
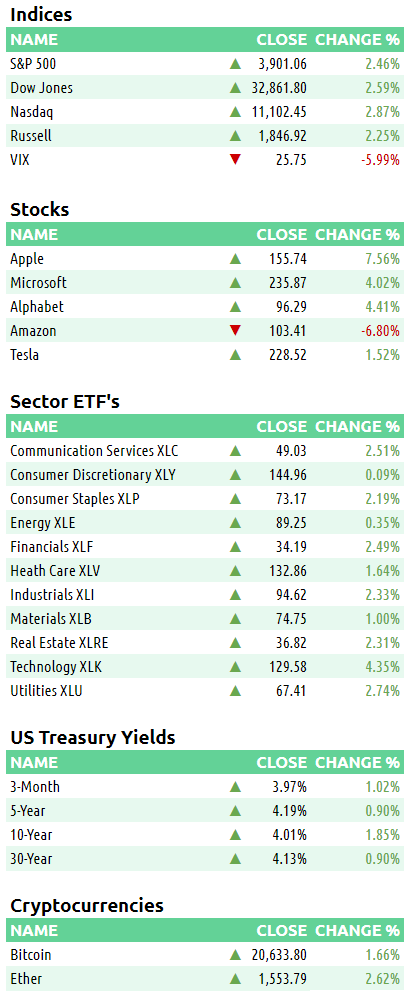
10/28/2022 Synopsis
Equities end the week on a high note. Dow on track for best October ever. Core CPE was in line with expectations.

Market Overview

Every index was green for the day with the Nasdaq leading the way. With one trading day left in the month, the S&P 500 is on track for its best October since 2015. Every S&P sector was up on the day with Technology XLK 0.00%↑ leading the way.
US Treasury yields also rose, ending several days in the red. The 2-year T-note finished at 4.424% (+3.36). The 10-year note closed above 4 again, finishing the day at 4.016% (+2.37%)
The US Dollar index had its second straight up day, gaining 0.09% to close at $110.668.
Here are some of today’s closing prices.
E-mini S&P 500 Top-Down Analysis

📈 Below are the monthly (5-years), weekly (2-years) and daily (6-months) charts for ES.
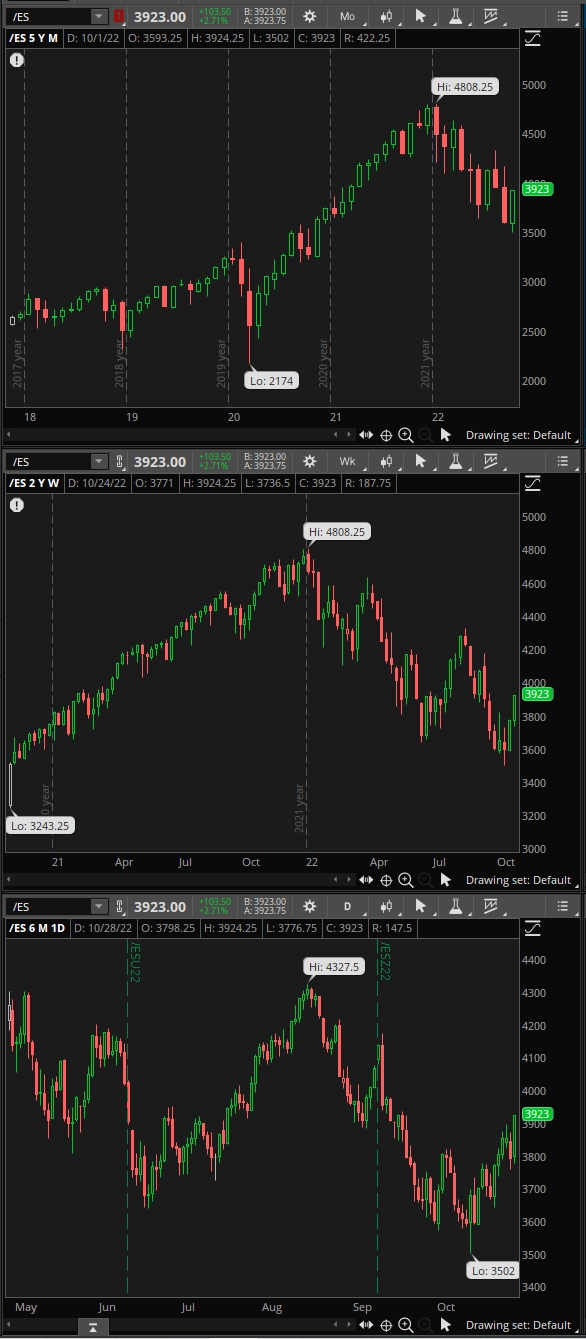
M/M: ES is OTFD as it failed to take out the prior month’s high and has traded and closed below the prior month’s low.
W/W: ES is OTFU on a weekly timeframe and has closed above its 10-week MA for the first time since early September.
D/D: ES is OTFU on a daily timeframe and has closed above its 50-day MA for the first time since September 12th.
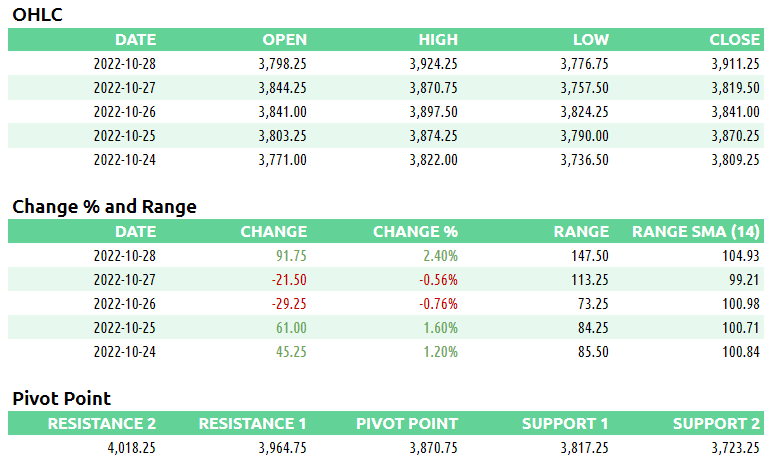
E-mini S&P 500 Metrics
Recent Performance & Technicals

E-mini S&P 500 Volume/Market Profile
ES Composite Volume Profile (5 days)
📈 Here is a chart of the past five sessions with a composite ETH Volume Profile:

ES ETH/RTH Split Volume Profile (5 days)
📈 Here is a chart of the past five sessions with a daily ETH/RTH split Volume Profile:
ES ETH/RTH Split Market/Volume Profile (today)
📈 Here’s a TPO chart of today’s session with ETH/RTH split Market/Volume Profile:
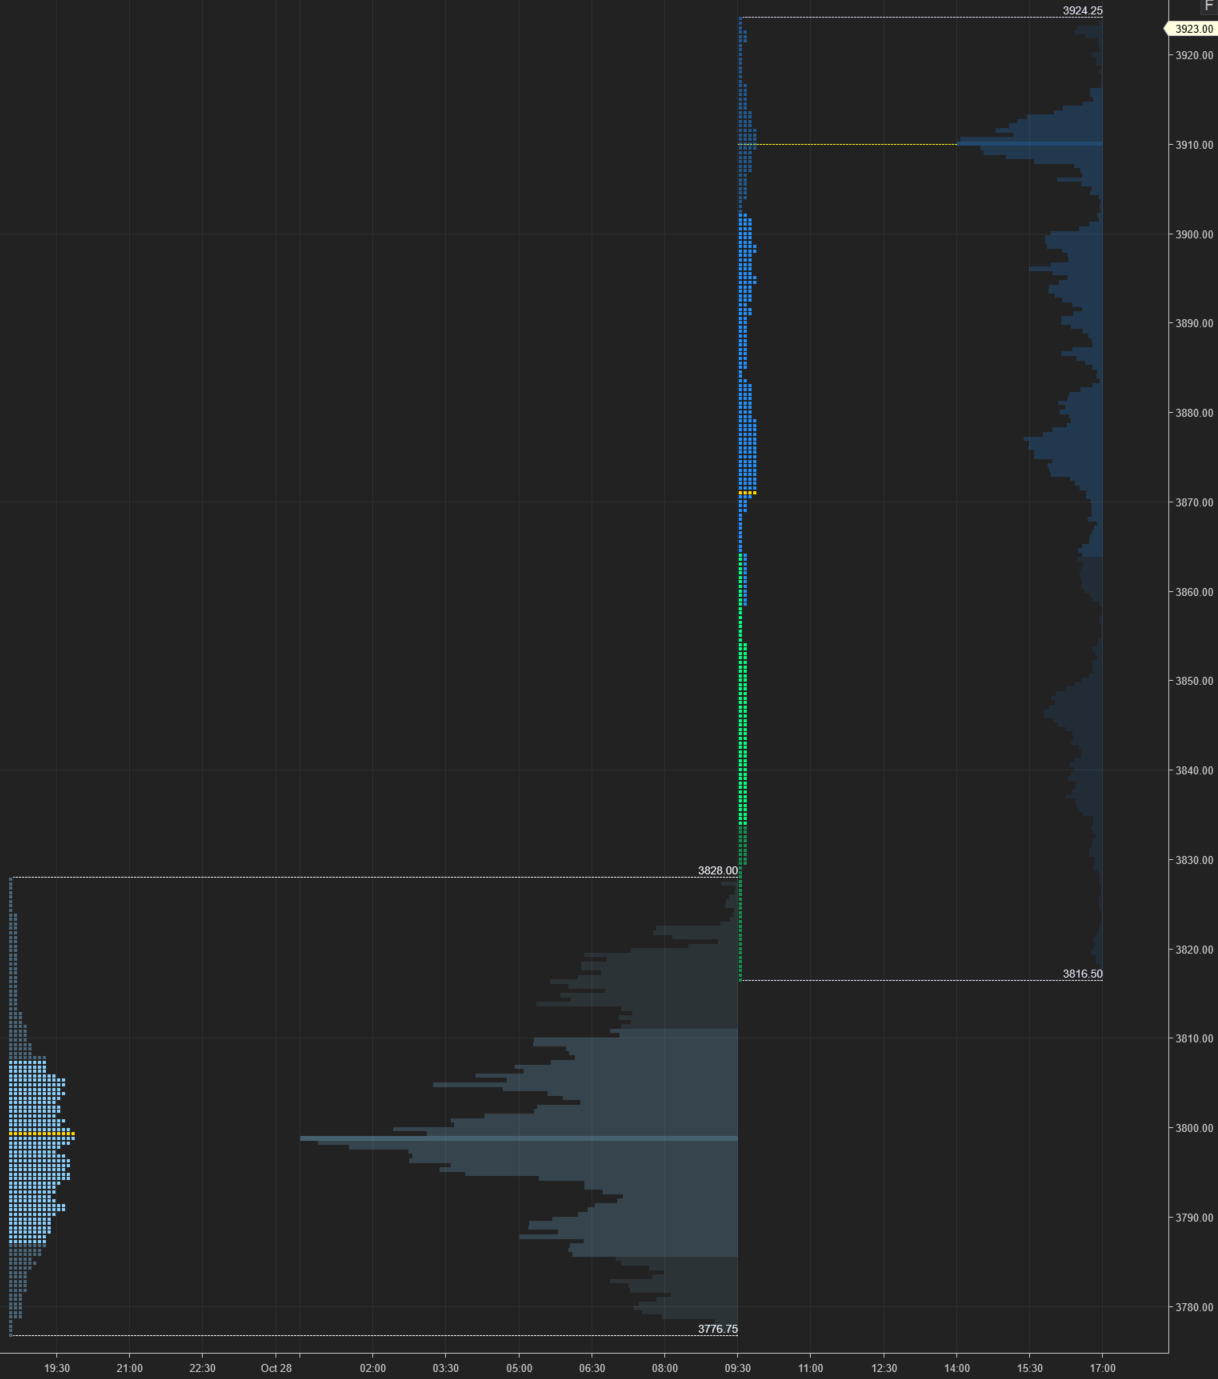
ES Market/Volume Profile Levels
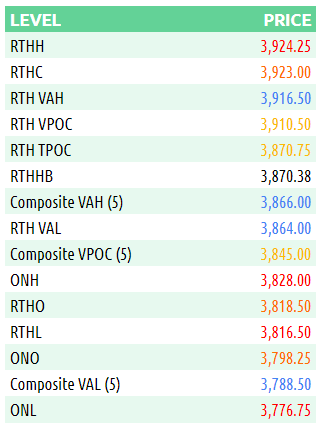
RTH Weak High/Low: n/a
RTH Single Prints: 3854 to 3858.50; 3864.25 to 3869.25; 3902 to 3904; 3916.50 to 3921.50
RTH Excess: 3816.50 to 3829.50; 3922.50 to 3924.25
RTH Gap: n/a
Session Recap
Electronic Trading Hours (ETH)
Globex Session:
Wholesale was short at the prior day’s close. The overnight open was below the previous day’s value area but above the low of the day. Inventory during the overnight session was mostly long, 78% of the time. The single prints from the previous day were mostly filled except for 2-ticks. Buyers didn’t lift the offer beyond 3813 as supply was present. The auction then reversed and fell beneath VWAP. Supply shut off at 3776.75. Shorts covered and brought ES back up to VWAP. When the core PCE figure was released at 8:30am EST, a 40-point stop run occurred which took out the previous overnight high. Once ES stabilized, buyers continued to lift the auction above VWAP.
Range: 51.25
Regular Trading Hours (RTH)
US Session:
The NY open was slightly below the prior day’s value area and below the T+2 low. There was demand at the open and lack of supply so ES climbed 50-points in the first hour of trading. ES was OTFU and rose above the prior day’s value area and high of the day. Responsive sellers appeared around 3883.50 and the uptrend stalled momentarily. Once the selling was absorbed by buyers, ES continued to trend upwards. The auction made new session highs for the remainder of RTH with virtually zero responsive selling.
📓 Noteworthy: There’s plenty of events next week and ES is coming up on another psychological level at 4000. To get there, buyers need to be able to absorb any sellers at two NVPOC’s; 3935 and 4003.50. These were from September 15th and 13th respectively.
Range: 107.75