
10/27/2022 Synopsis
Equities mixed again. Q3 US GDP growth exceeds estimates. Amazon falls after-hours after missing Q3 projections.

Market Overview

Equities were mixed again as the Dow and Russell registered gains. The Nasdaq and S&P took on losses. Six S&P sectors finished up on the day with industrials XLI 0.00%↑ leading the way. Communication services XLC 0.00%↑ fell the most.
US treasury yields continued their drop while bonds kept rising. The 3-day win streak for AGG 0.00%↑ and BND 0.00%↑ was the longest since late July. The 2-year note fell for the 3rd straight session and closed at 4.28%. The 10-year note fell and closed below 4%, ending the day at 3.92%.
The US Dollar index found some relief and gained 0.8% to finish at $110.56.
Here are some of today’s closing prices.

E-mini S&P 500 Top-Down Analysis

📈 Below are the monthly (5-years), weekly (2-years) and daily (6-months) charts for ES.

M/M: ES is OTFD as it failed to take out the prior month’s high and has traded and closed below the prior month’s low.
W/W: Barring a fall below 3590.50, ES will be OTFU. In addition, if ES can close above 3800.75 by week’s end, it will close above its 10-week MA for the first time since the first week in September.
D/D: For the 2nd straight session, ES rose above the 50-day MA but failed to close above it. ES also ended one time framing up (OTFU) by falling beneath the previous day’s low.
E-mini S&P 500 Metrics
Recent History and Performance
[insert 5-day historical/performance table here]

Technicals

E-mini S&P 500 Volume/Market Profile
ES Composite Volume Profile (5 days)
📈 Here is a chart of the past five sessions with a composite ETH Volume Profile:

ES ETH/RTH Split Volume Profile (5 days)
📈 Here is a chart of the past five sessions with a daily ETH/RTH split Volume Profile:
ES ETH/RTH Split Market/Volume Profile (today)
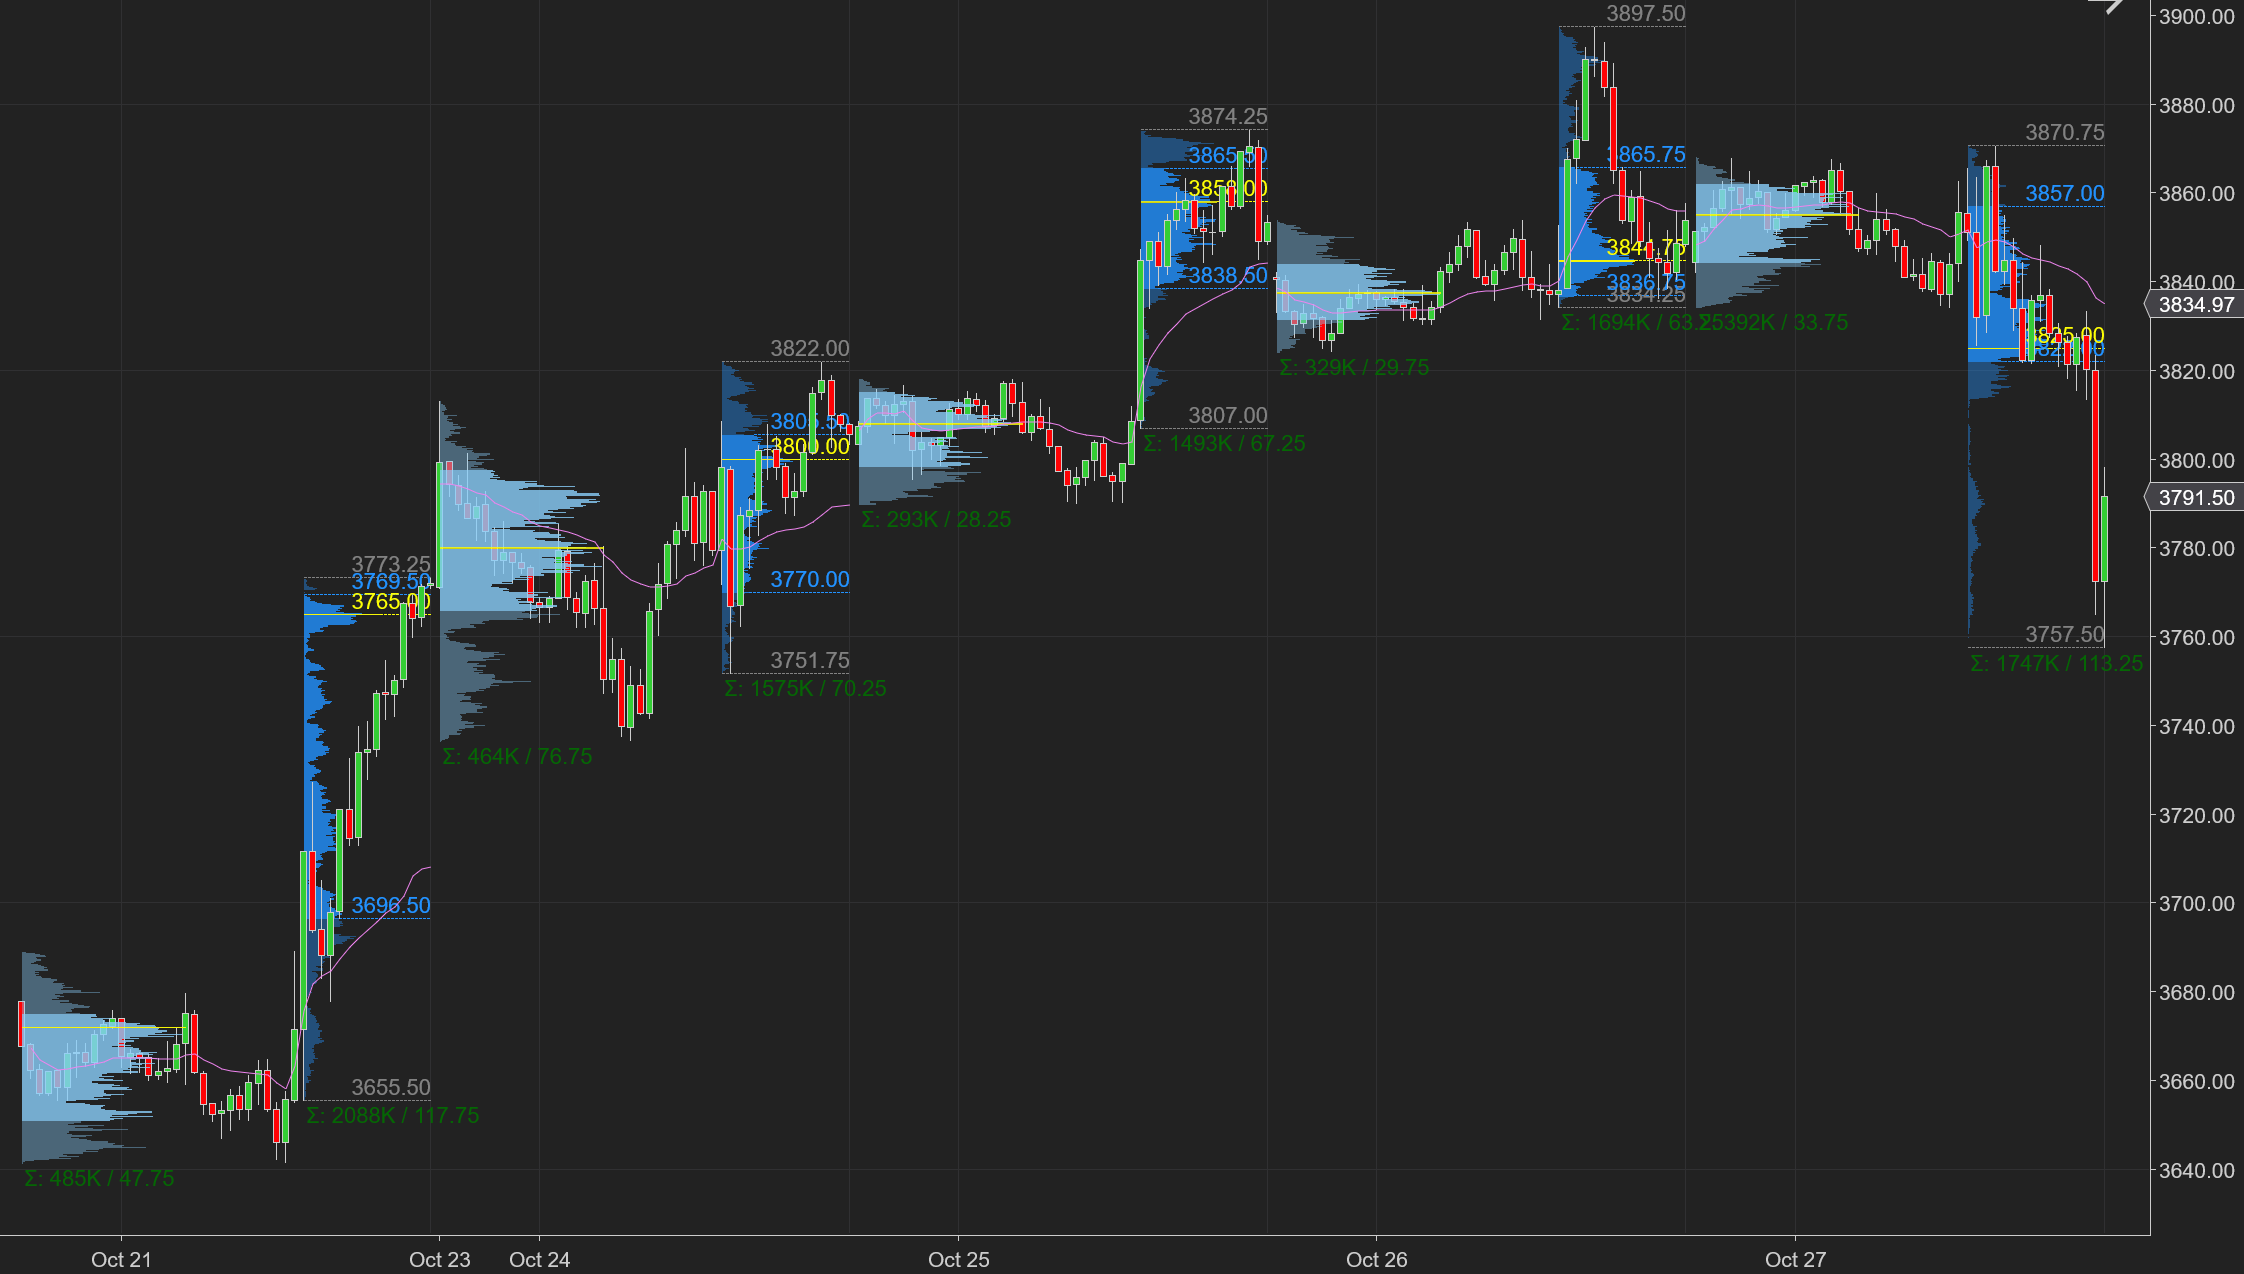
📈 Here’s a TPO chart of today’s session with ETH/RTH split Market/Volume Profile:

ES Market/Volume Profile Levels

RTH Weak High/Low: n/a
RTH Single Prints: 3798.25 to 3813.50
RTH Excess: 3757.5 to 3765; 3867.50 to 3870.75
RTH Gap: n/a
Session Recap
Electronic Trading Hours (ETH)
Globex Session:
At the prior day’s close, wholesale was short. The overnight open was inside of the prior day’s value area. Inventory during the overnight session was mixed and mostly long, about 65%. ES was rotating inside of a 30 to 35-point channel. Wholesale sold their inventory from the previous afternoon over VWAP when demand was present. The auction rose above yesterday’s value area high by a few ticks but reversed as supply was present. As wholesale searched for a bid, ES fell back into yesterday’s value area. Supply shut off at 3834.25, the prior day’s low, as buyers came and lifted the offer.
📓 Noteworthy: A weak high, double-top was left at 3868 and a weak low, double-bottom was left at 3834.25.
Range: 33.75
Regular Trading Hours (RTH)
US Session:
The NY open was inside of the prior day’s value area and inside the T+2 high and low. There was a stop run after the opening bell which then got supply thrown at it. Sellers hit the bid and drove ES down below the overnight low and previous day’s low. ES fell 40-points in A-period. As price began to reach the bottom excess area from Tuesday, it began to stall. Trapped short traders covered which resulted in a bounce off 3825.50, minus 3 standard deviations below VWAP. In B-period, ES rallied to reclaim the losses from the previous half hour. After trading above the overnight high, ES ran into sellers and proceeded to fall after reaching a high of 3870.75. The market fell 50-points over the next 4-TPO periods and took out the prior swing low in the process. Responsive buyers at 3821.50 to provide some relief. Once the buying ended, supply drove ES down further to new session lows. The NY session ended with ES at 3820.25. However, in the final hour of RTH, Amazon AMZN 0.00%↑ disappointed with earnings and guidance. This sent ES into a 70-point free fall in the final hour of RTH.
📓 Noteworthy: ES’ fall in the last hour briefly took it below the 50% level, 3769.5, for the week before it bounced back above at the close. The 61.8% retracement level is 3799.71.
Range: 113.25