
10/26/2022 Synopsis
Equities were mixed as mega-cap tech falters. The 3m10y yield curve briefly inverts.

Market Overview

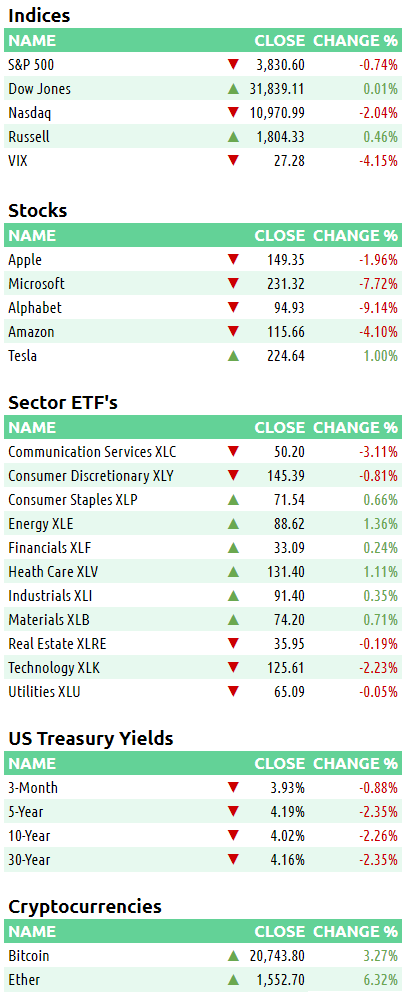
Two of the four major indices were green with the Russell having the highest gain. Mega-cap tech and the Nasdaq lagged the entire day after disappointing earnings and/or guidance from Alphabet GOOGL 0.00%↑ and Microsoft MSFT 0.00%↑ yesterday. The S&P was up for the entire morning before losing all its gains in the afternoon. The S&P still managed to close above its 61.8% retracement level (pandemic intra-day low to January intra-day high) for the 2nd straight day. Six S&P sector finished green led by energy XLE 0.00%↑ and health care XLV 0.00%↑. Health crossed over and closed above its 200-day MA today, joining energy as the only two S&P sectors above their 200-day MA.
US Treasury yields continued their fall. The 3-month T-bill and the 10-year T-note inverted today. Economists believe that the 10y-3mo yield curve is a more accurate predictor of a future recession than the 10y-2yr, which has been inverted for months. The 2-year T-note slipped 1.67% to 4.408%. The 10-year note dropped 2.41% down to 4.007%.
The US Dollar index fell 1.08% to close at $109.69, a 5-week low.
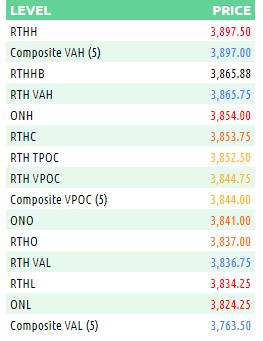
Here are some of today’s closing prices.
E-mini S&P 500 Top-Down Analysis

📈 Below are the monthly (5-years), weekly (2-years) and daily (6-months) charts for ES.

M/M: ES is OTFD as it failed to take out the prior month’s high and has traded and closed below the prior month’s low.
W/W: Barring a fall below 3590.50, ES will be OTFU. In addition, if ES can close above 3800.75 by week’s end, it will close above its 10-week MA for the first time since the first week in September.
D/D: ES continued to OTFU despite having lost its gains from early in the NY session. ES eclipsed its 50-day MA momentarily but couldn’t close above it.
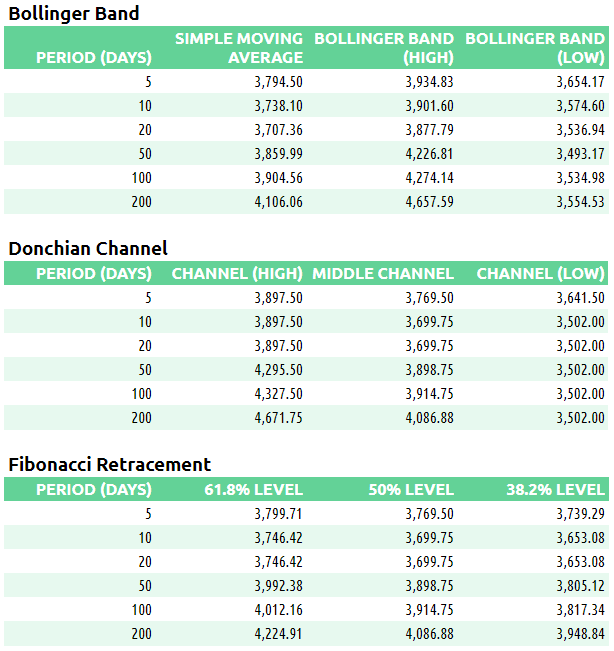
E-mini S&P 500 Metrics
Recent History and Performance
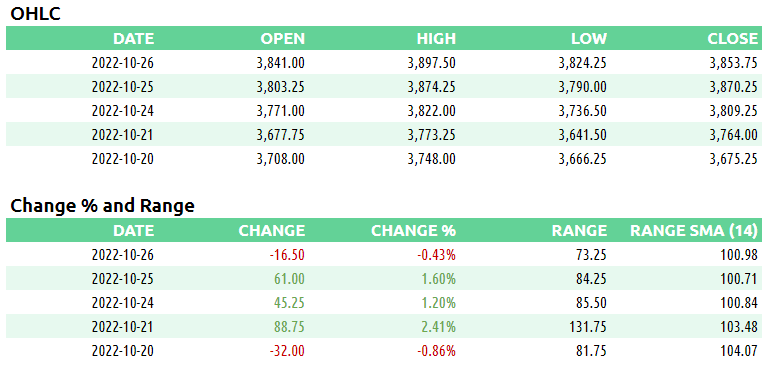
Technicals
E-mini S&P 500 Volume/Market Profile
ES Composite Volume Profile (5 days)
📈 Here is a chart of the past five sessions with a composite ETH Volume Profile:

ES ETH/RTH Split Volume Profile (5 days)
📈 Here is a chart of the past five sessions with a daily ETH/RTH split Volume Profile:
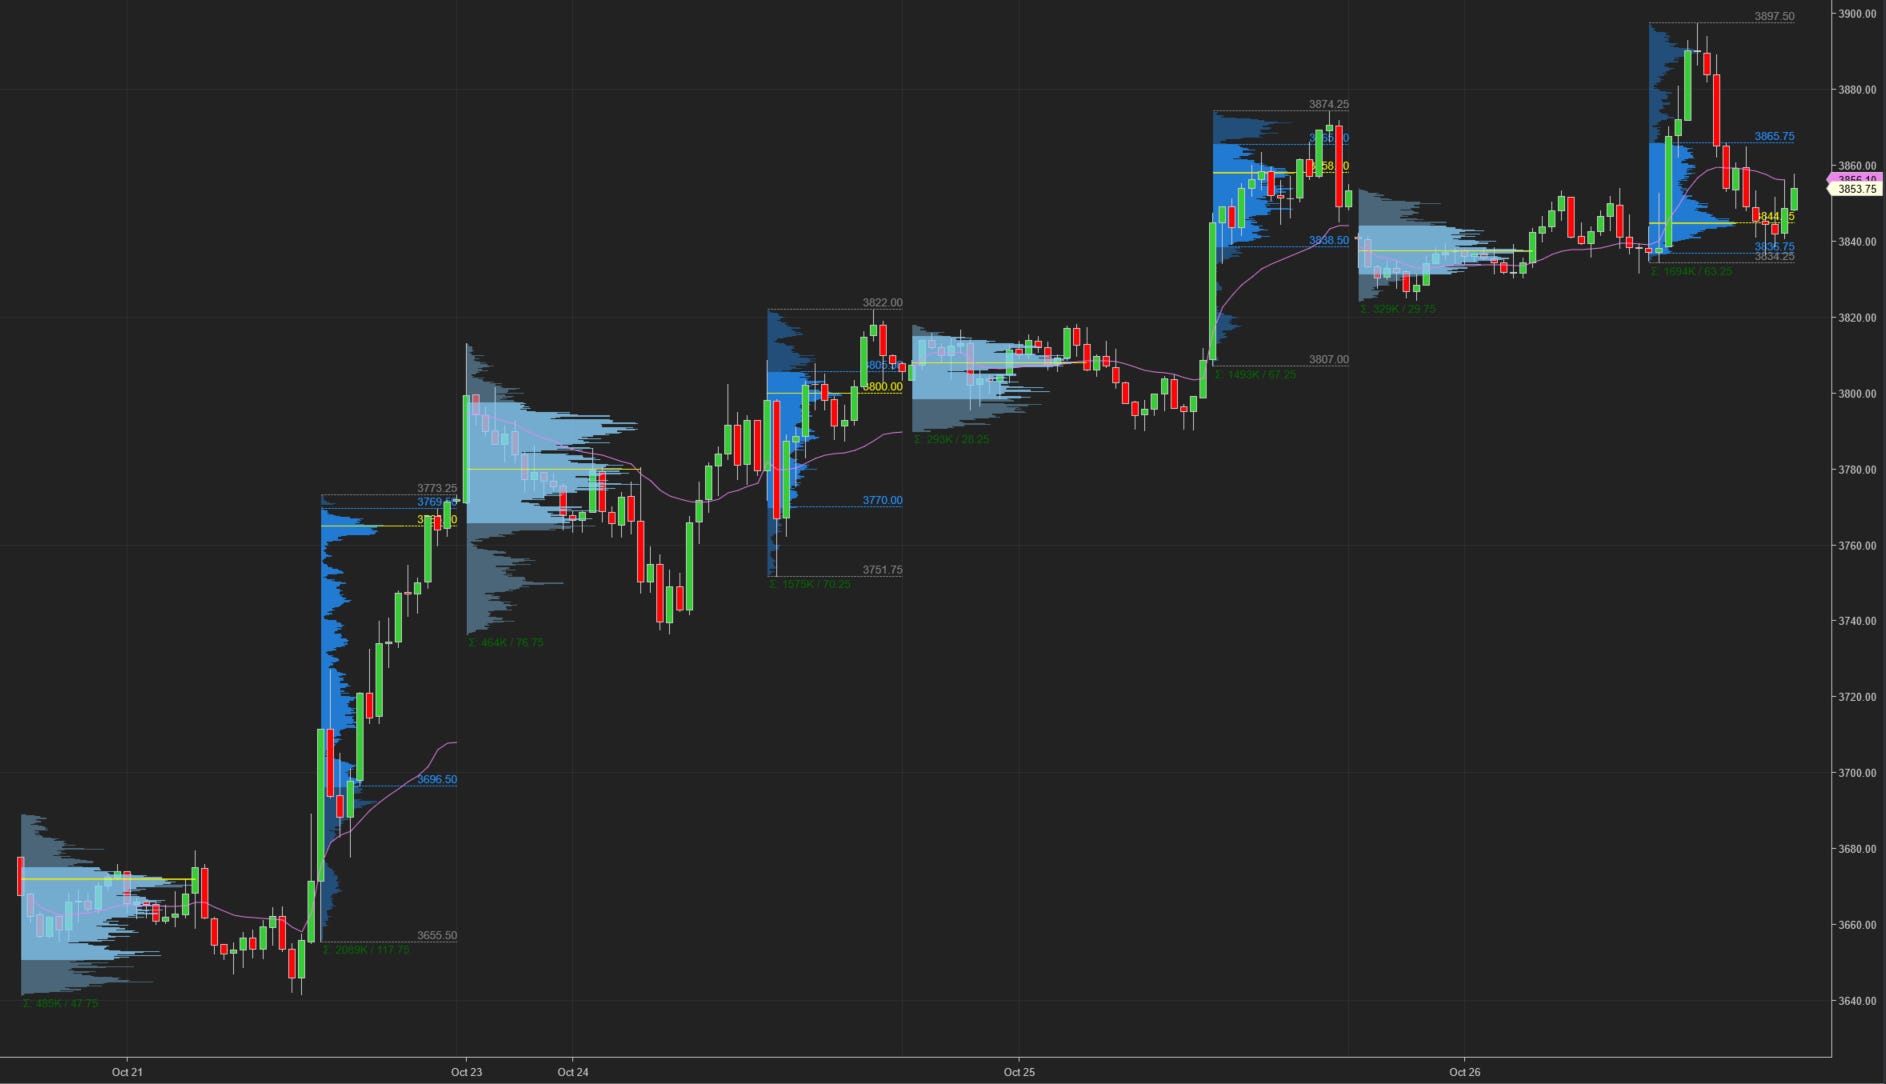
ES ETH/RTH Split Market/Volume Profile (today)
📈 Here’s a TPO chart of today’s session with ETH/RTH split Market/Volume Profile:

ES Market/Volume Profile Levels
RTH Weak High/Low: n/a
RTH Single Prints: n/a
RTH Excess: 3834.25 to 3838.50; 3894 to 3897.50
RTH Gap: n/a
Session Recap
Electronic Trading Hours (ETH)
Globex Session:
Wholesale was long at the prior day’s close. The overnight open was inside of the previous day’s value area. Inventory in the overnight session was 100% short. Like the prior overnight session, ES was rangebound inside a 30-point channel. The auction rotated above and below VWAP and in and out of the prior day’s value area.
Range: 29.75
Regular Trading Hours (RTH)
US Session:
The NY open was just under the previous day’s value area and above the T+2 high. At the opening bell, buyers moved ES nearly 3 standard deviations (-1 to +2) before responsive sellers were met at 3852.75, several ticks below the overnight high. This supply sank the auction back underneath VWAP. In B-period, the 2nd half hour of NYSE trading, supply shut off and ES jumped nearly 30-points in a positive reaction to the home sales report. ES continued one time framing up (OTFU) and eventually eclipsed the prior day’s high and 50-day simple moving average (SMA). Buyers eventually faded as ES approached the 3900 level. Longs failed to lift the offer past 3897.50 where supply was sitting. The market dropped 60-points over the next 8-TPO periods. Sellers couldn’t drop the offer below 3836.25 and buyers front ran the prior session low. ES was stabilized and closed RTH nearly 30-points higher.
📓 Noteworthy: Wholesale continued to distribute inventory to willing buyers early in the NY session, rising over the 50-day MA in the process. The rally stalled several points shy of the 3900 level, which is a psychological level. The 100-day MA and VPOC from September are near 3900, so there should be supply around this area.
Range: 63.25
Links
US new home sales fall in September in the face of rapidly rising mortgage rates.
The 3-month Treasury bill and 10-year Treasury note inverted today. Here’s what that could signal.
Meta META 0.00%↑ falls 19% in extended trading after revenue and average revenue per user fail to meet analyst expectations.