
10/25/2022 Synopsis
Equity win streak extends to three. Home prices and consumer confidence falls. Microsoft and Alphabet fall in extended trading.

Market Overview

Equities rally for the 3rd consecutive session with the Russell and Nasdaq leading the way. The S&P 500 closed above the 50-day EMA and is 0.24% from it’s 50-day SMA. Every S&P sector was green with real estate XLRE 0.00%↑ leading the way. Energy XLE 0.00%↑ with a +0.1% gain fared the worst.
The Vanguard Total Bond Market ETF BND 0.00%↑ and iShares Core U.S. Aggregate Bond ETF AGG 0.00%↑, two of the largest bond ETF’s, both gapped up today. They each gained nearly a full 100 bps as US Treasury yields fell. The 2-year T-note dropped to 4.483% (-0.58%). The 10-year note lost 3.25% and closed at 4.106%.
The US Dollar index slid 0.99% to end the day at $110.89. It is not nearly 3% off the recent closing high from last month.
Here are some of today’s closing prices.

E-mini S&P 500 Top-Down Analysis
📈 Below are the monthly (5-years), weekly (2-years) and daily (6-months) charts for ES.

M/M: ES is OTFD as it failed to take out the prior month’s high and has traded and closed below the prior month’s low.
W/W: Barring a fall below 3590.50, ES will be OTFU. In addition, if ES can close above 3805.44 by week’s end, it will close above its 10-week EMA for the first time since the first week in September.
D/D: ES is OTFU and has broken out of last week’s price range. It has also closed above its 50-day EMA. The 50-day SMA is at 3879.63.
E-mini S&P 500 Metrics
Recent History and Performance

Technicals

E-mini S&P 500 Volume/Market Profile
ES Composite Volume Profile (5 days)
📈 Here is a chart of the past five sessions with a composite ETH Volume Profile:

ES ETH/RTH Split Volume Profile (5 days)
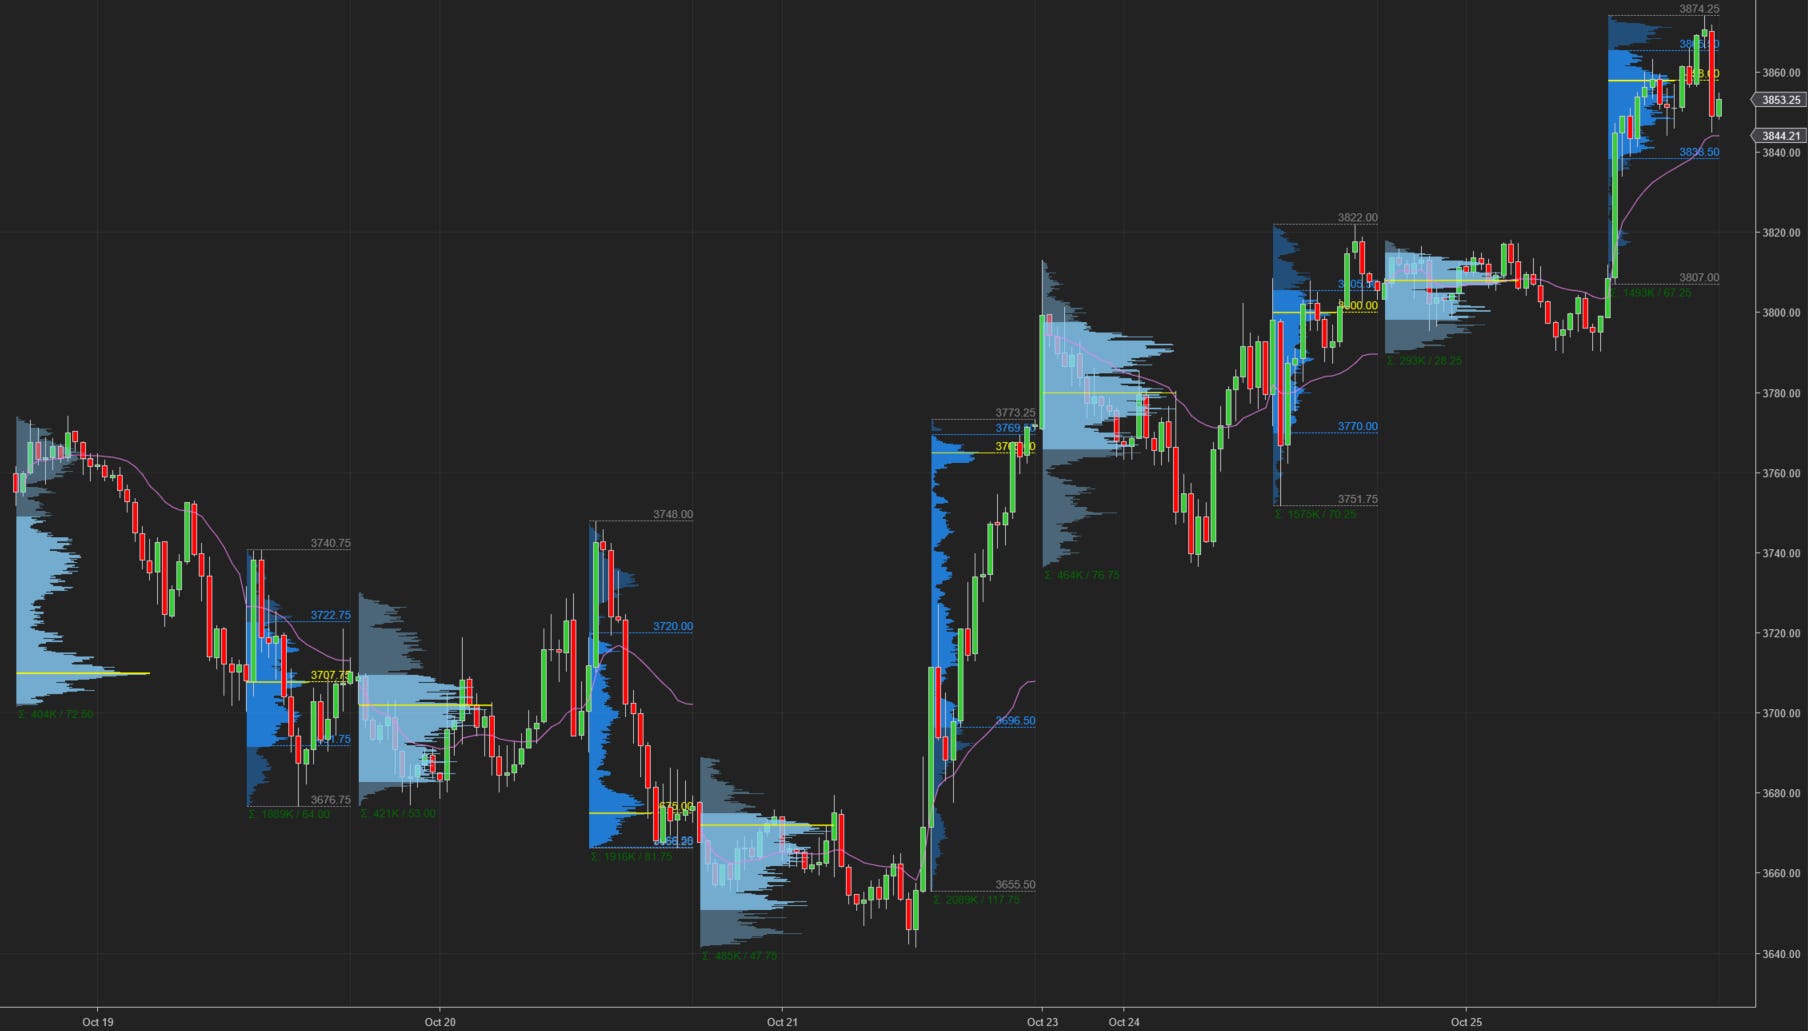
📈 Here is a chart of the past five sessions with a daily ETH/RTH split Volume Profile:
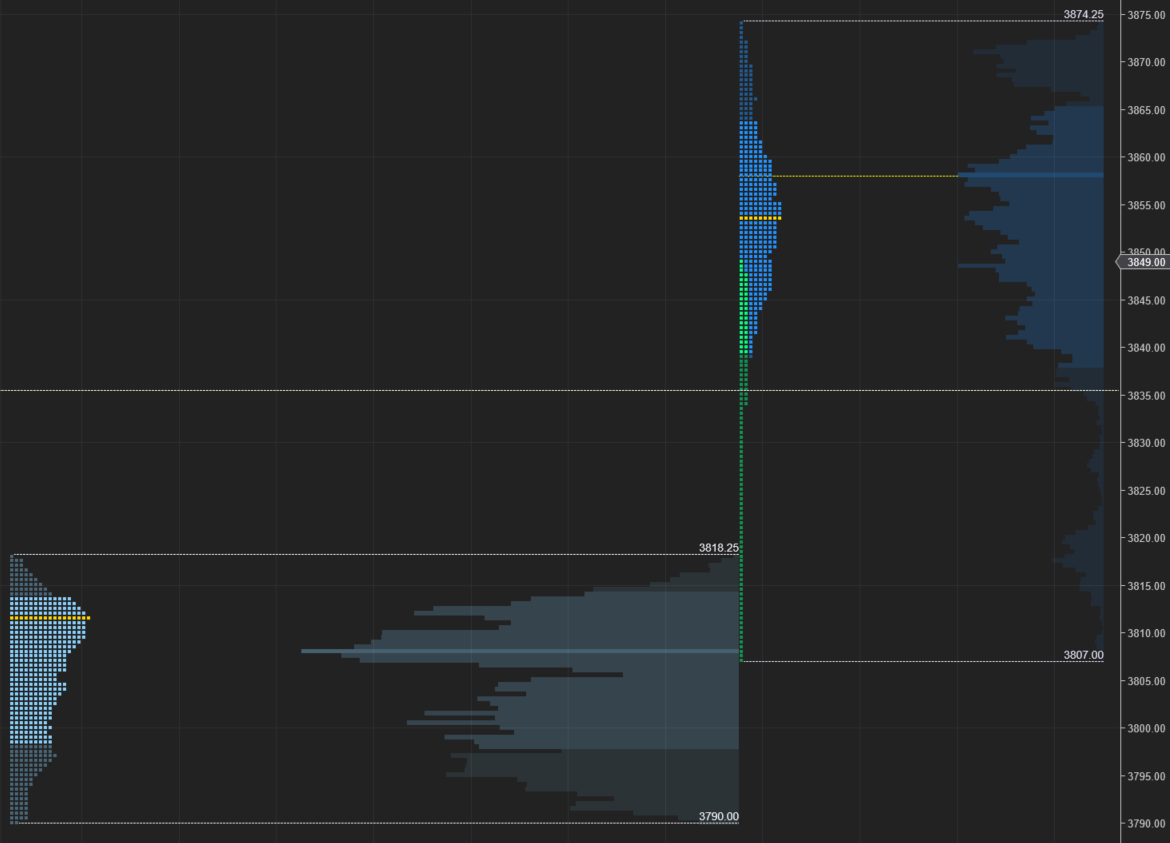
ES ETH/RTH Split Market/Volume Profile (today)
📈 Here’s a TPO chart of today’s session with ETH/RTH split Market/Volume Profile:
ES Market/Volume Profile Levels
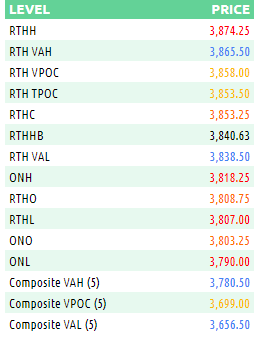
RTH Weak High/Low: n/a
RTH Single Prints: n/a
RTH Excess: 3807 to 3834; 3872 to 3874.25
RTH Gap: n/a
Session Recap
Electronic Trading Hours (ETH)
Globex Session:
Wholesale was long at the prior day’s close. The overnight open was just inside the prior day’s value area. Inventory during the overnight session was mixed but mostly long in a consolidated 30-point range. ES’ price action rotated around VWAP in this tighter than usual range between 3790 and 3818.25.
📓 Noteworthy: The entire session was underneath the previous day’s high. There was a lack of demand overnight to absorb the offers above 3818.25. There was a weak low at 3790, an area that was tested during 4-TPO periods overnight. The overnight session lacked enough supply to absorb these trapped shorts and their resting bid orders and thus the market couldn’t drop any further.
Range: 28.25
Regular Trading Hours (RTH)
US Session:
The NYSE open was inside of the prior day’s value area and above the T+2 high. There was a lack of sellers at the open so buyers were able to lift the market 40-handles, or 3 standard deviations, all in A-period, or the first 30 minutes of trading. Throughout the morning and early afternoon, demand was able to absorb responsive sellers and continue to push ES to new session highs. When ES’ price hit 3863.50, that was when the longest responsive selling, or backfill as @vwaptrader would say, occurred. The auction fell by about 20-points before supply was cut off and longs initiated more buying. ES made several more new session highs but finally stalled at 3874.25. After the closing bell, ES fell 30-handles on disappointing earnings from Alphabet GOOGL 0.00%↑ and Microsoft MSFT 0.00%↑.
📓 Noteworthy: Wholesale continues to distribute at higher prices. Today’s upward move has put the current price for ES above September’s VWAP. The high of the day for today was 5-points shy of the 50-day moving average. In addition, there is supply between 3860 through 3895. This was a high-volume area from September where ES spent roughly 6-days trading in.
Range: 67.25
Links
As per the S&P CoreLogic Case-Schiller Home Price index, home prices fell last month by the fastest pace on record. In addition, consumer confidence falls for the first time in 2-months.
Alphabet GOOGL 0.00%↑ was down 6% in afterhours after missing on both top and bottom lines.
Microsoft MSFT 0.00%↑ beat on top and bottom lines but guidance fell short of expectations causing the stock to fall 7% in extended trading.