
06/05/2023 Synopsis
Services sector and factory order data drag markets lower.

Market Overview

The S&P 500 was down in today’s session. 4/11 sectors were positive.
Outperforming Index: 🟢 Nasdaq-100 QQQ 0.00%↑
Underperforming Index: 🔴 Russell 2000 IWM 0.00%↑
Strongest Sector: 🟢 Utilities XLU 0.00%↑
Weakest Sector: 🔴 Industrials XLI 0.00%↑
Top Stock: 🟢 Bath and Body Works BBWI 0.00%↑
Poorest Stock: 🔴 EPAM Systems EPAM 0.00%↑
US Treasury yields retreated.
2-year: 🔴 4.47% (-3.9 bps)
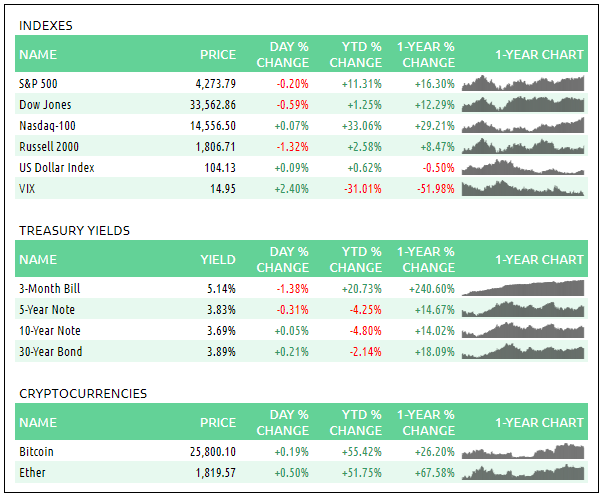
📈 Here is the broad market overview as of the current day’s close.
S&P 500 Breakdown
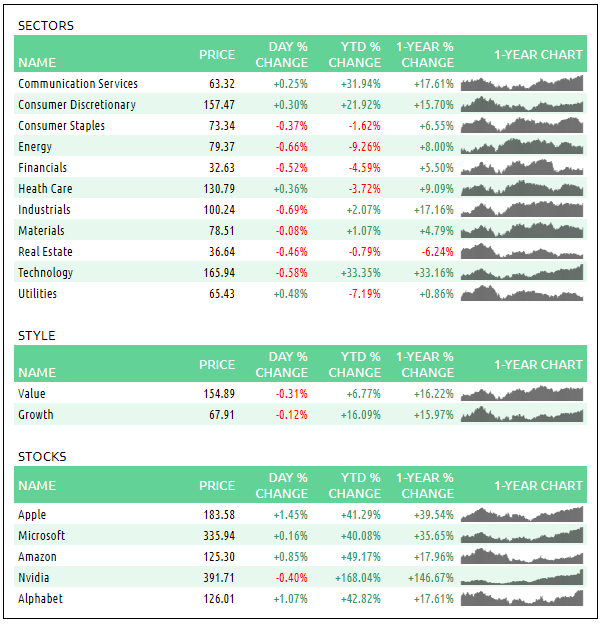
📈 Here is a breakdown of the S&P 500 by sector, style and top holdings.
E-mini S&P 500 Top-Down Analysis
📈 Below are the monthly, weekly, daily and 4-hour charts for $ES_F.
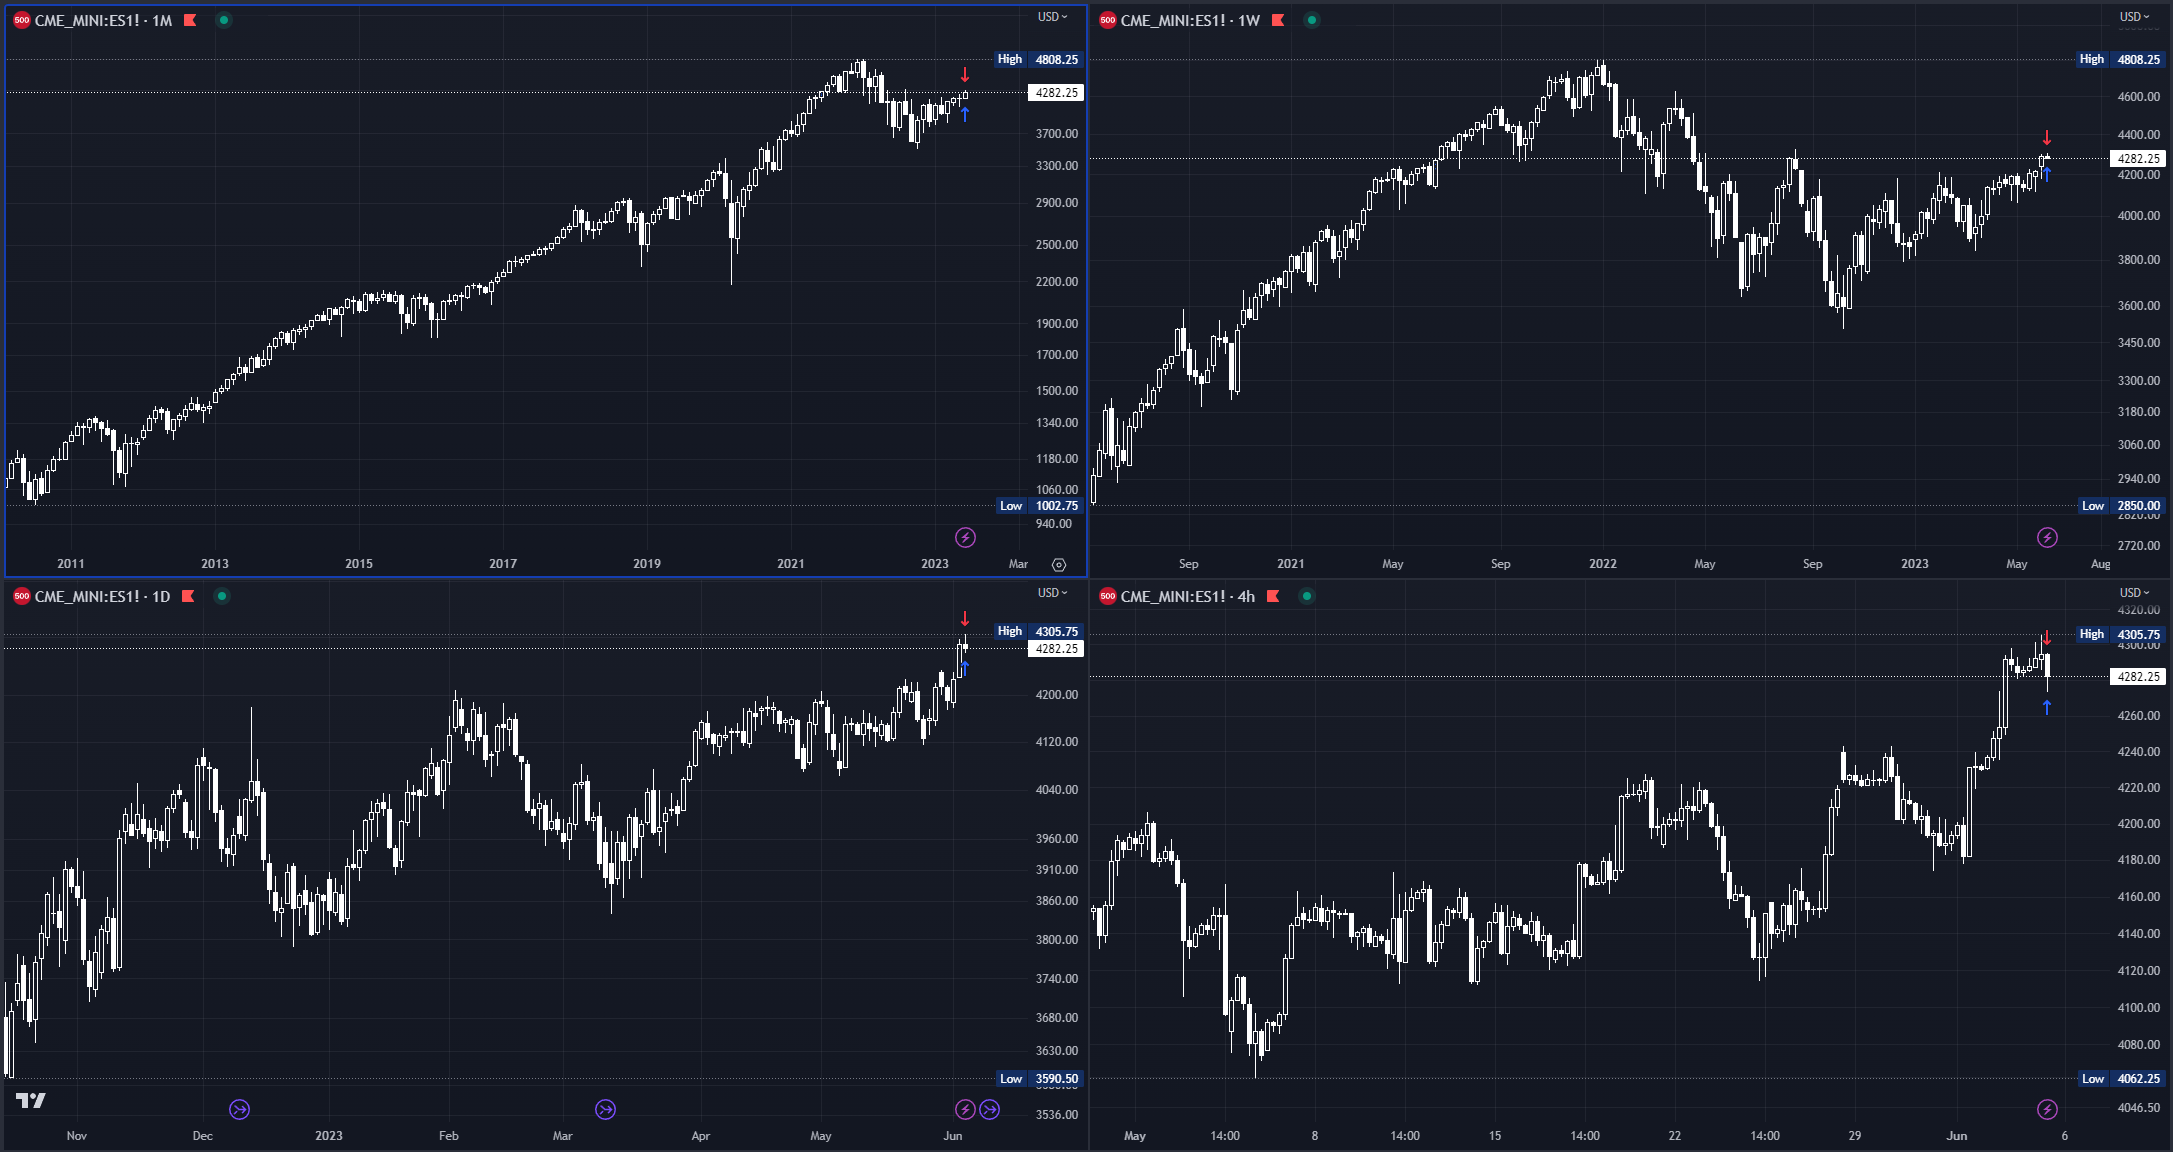
Monthly: 🟡 Balance / outside month. [Last 2-months: 4062.25 - 4243.25]
Weekly: 🟢 One time framing up. [Nearest low: 4174]
Daily: 🟢 One time framing up. [Nearest low: 4273]
E-mini S&P 500 Metrics
Recent Performance & Technicals


E-mini S&P 500 Volume Profile
ES VWAP/Volume Profile Levels

Session Recap
Electronic Trading Hours (ETH)
Overnight Session:
Wholesale was long at the prior day’s close. The overnight open was inside the prior day’s value area. The Asian and European sessions traded sideways in a 13-point channel, all of which was inside Friday’s value area. Inventory going into the RTH session was slightly long. Overnight VPOC was 4289, nearly inline with Friday’s RTH VPOC.
Regular Trading Hours (RTH) Session:
The RTH open was inside the prior day’s value area and above the T+2 high. There was no gap between the previous day’s RTH range and the RTH open. The stops at the overnight and prior day’s high were taken out during A-period. The IB period was choppy with price action going in and out of Friday’s RTH range. B-period formed an outside candle to A-period, forming an 18.50-point range, that failed to trade below the overnight low. The auction rotated up and was creating higher lows as buyers and trapped shorts slowly lifted the offer. Overheard supply at 4305.75, three standard deviations north of VWAP, soaked in all the demand. Sellers pushed $ES_F back into the prior day’s range once the buying ceased. From H through M-period, price action was setting lower highs as stops at the overnight low were taken. The C-period single prints from Friday were also filled. However, sellers were only able to push down beyond the singles for 3-ticks, as $ES_F ended up with a weak low double bottom at 4273. This was a sign that buyers were trapped short and covering at this level, three standard deviations south of VWAP. They pushed the offer up and back into the overnight range. RTH VPOC moved down to 4280.50 as price action consolidated for the remainder of the RTH session.