
06/02/2023 Synopsis
Equities rise after Senate's passage of debt-ceiling bill and jobs data.

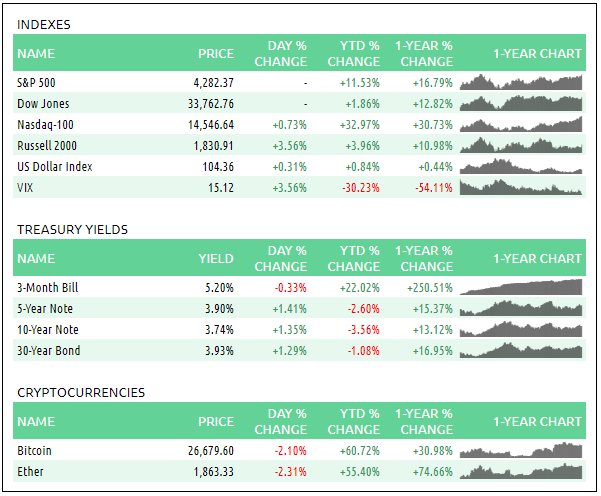
Market Overview

The S&P 500 was up in today’s session. 11/11 sectors were positive.
Outperforming Index: 🟢 Russell 2000 IWM 0.00%↑
Underperforming Index: 🔴 Nasdaq-100 QQQ 0.00%↑
Strongest Sector: 🟢 Materials XLB 0.00%↑
Weakest Sector: 🔴 Communications XLC 0.00%↑
Top Stock: 🟢 DISH Network Corporation DISH 0.00%↑
Poorest Stock: 🔴 T-Mobile US TMUS 0.00%↑
US Treasury yields advanced.
2-year: 🟢 4.55% (+4 bps)
📈 Here is the broad market overview as of the current day’s close.
S&P 500 Breakdown
📈 Here is a breakdown of the S&P 500 by sector, style and top holdings.

E-mini S&P 500 Top-Down Analysis
📈 Below are the monthly, weekly, daily and 4-hour charts for $ES_F.

Monthly: 🟡 Balance / outside month. [Last 2-months: 4062.25 - 4243.25]
Weekly: 🟢 One time framing up. [Nearest low: 4174]
Daily: 🟢 One time framing up. [Nearest low: 4229]
E-mini S&P 500 Metrics
Recent Performance & Technicals


E-mini S&P 500 Volume Profile
ES VWAP/Volume Profile Levels

Session Recap
Electronic Trading Hours (ETH)
Overnight Session:
Wholesale was long at the prior day’s close. The overnight open was inside the prior day’s value area. Price action overnight was flat and couldn’t trade below 4229. There were several trapped short positions the last few days and their bids provided support at 4229. The auction rotated up and climbed above the prior day’s high. Inventory going into the RTH session was long. Overnight VPOC was 4249.50.
Regular Trading Hours (RTH) Session:
The RTH session gapped up above the prior day’s range and T+2 range. Buyers were able to take the stops above the overnight high during A-period. Supply was able to absorb buyers and this resulted in backfill. Sellers were absorbed at 4249, keeping the RTH gap in tact. The auction rotated up for the remainder of the RTH session. ES_F climbed nearly 50-handles before stalling just shy of 4300. The auction consolidated in a 10-point range for the remainder of the session.