05/30/2023 Synopsis
Equities close mixed as congressional hurdles loom on debt-ceiling bill.
Market Overview
The S&P 500 was up in today’s session. 4/11 sectors were positive.
Outperforming Index: 🟢 Nasdaq-100 QQQ 0.00%↑
Underperforming Index: 🔴 Russell 2000 IWM 0.00%↑
Strongest Sector: 🟢 Consumer Discretionary XLY 0.00%↑
Weakest Sector: 🔴 Consumer Staples XLP 0.00%↑
Top Stock: 🟢 Paramount Global PARA 0.00%↑
Poorest Stock: 🔴 Mondelez International Inc MDLZ 0.00%↑
US Treasury yields retreated.
2-year: 🔴 4.44% (-0.4 bps)
📈 Here is the broad market overview as of the current day’s close.
S&P 500 Breakdown
📈 Here is a breakdown of the S&P 500 by sector, style and top holdings.
E-mini S&P 500 Top-Down Analysis
📈 Below are the monthly, weekly, daily and 4-hour charts for $ES_F.
Monthly: 🟢 Higher low. [Nearest Low: 4068.75]
Weekly: 🟡 Balance. [Last 3-weeks: 4111.75 - 4227.25]
Daily: 🟢 One time framing up. [Nearest low: 4200]
E-mini S&P 500 Metrics
Recent Performance & Technicals
E-mini S&P 500 Volume Profile
ES ETH/RTH Split Volume Profile
📈 Here is a chart of the past few sessions with a daily ETH/RTH split Volume Profile:
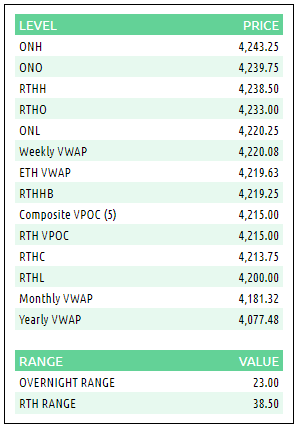
ES VWAP/Volume Profile Levels
Session Recap
Electronic Trading Hours (ETH)
Extended Overnight Session (includes Monday holiday):
Wholesale was long at the prior day’s close. The overnight open was above the prior day’s value range. Supply above 4243.25 provided resistance and soaked up all buyers. The auction rotated south and got inside Friday’s high by one point but could not follow through. Resting bids mopped up supply and eventually supply dried up. Buyers were able to easily lift the offer up near the initial high from the Sunday evening Asian open, resulting in a weak high at 4243.25. Inventory going into RTH was long with net sellers trapped in their positions.
Regular Trading Hours (RTH) Session:
The RTH open gapped up above the prior day’s high and T+2 high. After failing to take the stops at the overnight high during A-period, $ES_F turned south as sellers marked price down in search for buyers. The RTH gap was closed with price continuing to fall with lower highs established from A through I-period. $ES_F got underneath Friday’s HVN and value area but couldn’t trade inside the B-period single prints. Trapped shorts covered and the 4200 level held. This spurred a 20-point bounce to bring price back up above VWAP momentarily. Supply was able to absorb the short covering as $ES_F fell back underneath VWAP. There it remained and traded sideways into the close right near the 4215 cost basis for the session.


