
05/24/2023 Synopsis
Equity markets fell with the focus on debt-ceiling talks and Fed meeting minutes.

Market Overview
The S&P 500 was down in today’s session. 1/11 sectors were positive.
Outperforming Index: 🟢 Nasdaq-100 QQQ 0.00%↑
Underperforming Index: 🔴 Russell 2000 IWM 0.00%↑
Strongest Sector: 🟢 Energy XLE 0.00%↑
Weakest Sector: 🔴 Real estate XLRE 0.00%↑
Top Stock: 🟢 Illumina ILMN 0.00%↑
Poorest Stock: 🔴 Analog Devices ADI 0.00%↑
US Treasury yields advanced.
2-year: 🟢 4.36% (+4.1 bps)
📈 Here is the broad market overview as of the current day’s close.

S&P 500 Breakdown
📈 Here is a breakdown of the S&P 500 by sector, style and top holdings.

E-mini S&P 500 Top-Down Analysis
📈 Below are the monthly, weekly, daily and 4-hour charts for $ES_F.

Monthly: 🟢 Higher low. [Nearest Low: 4068.75]
Weekly: 🟢 One time framing up. [Nearest low: 4120]
Daily: 🟡 Lower high and settled in the previous balance area. [Nearest high: 4166.25]
E-mini S&P 500 Metrics
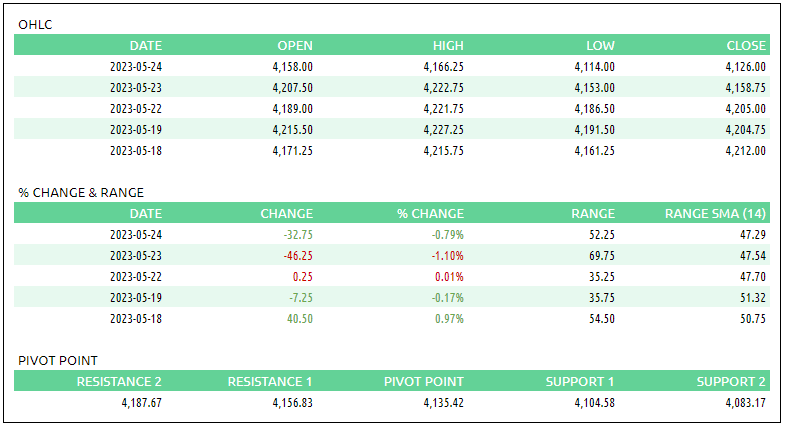
Recent Performance & Technicals

E-mini S&P 500 Volume Profile
ES ETH/RTH Split Volume Profile
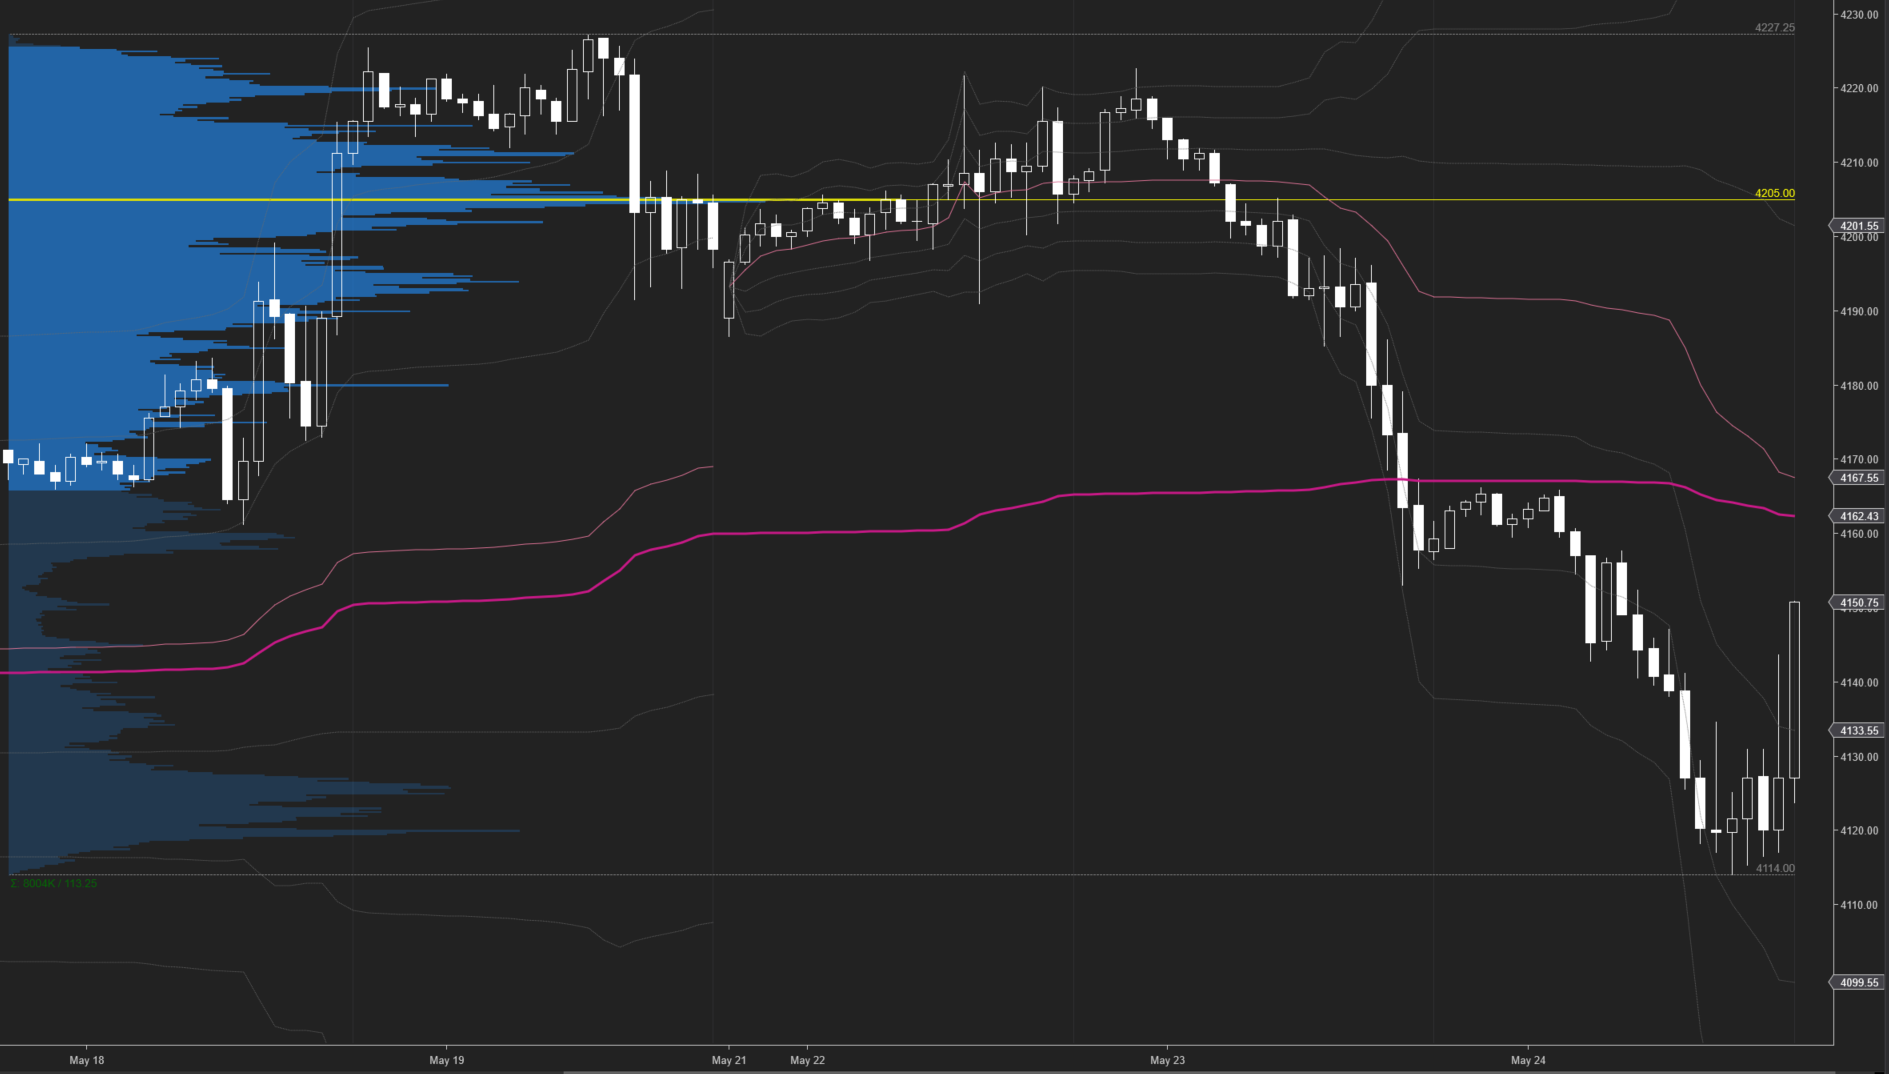
📈 Here is a chart of the past few sessions with a daily ETH/RTH split Volume Profile:

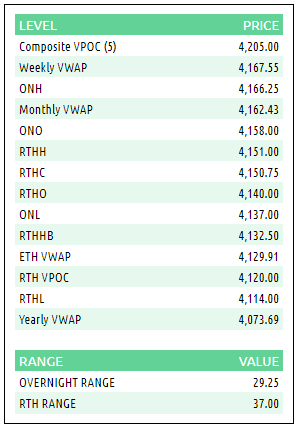
ES VWAP/Volume Profile Levels
Session Recap
Electronic Trading Hours (ETH)
Overnight Session:
Wholesale was short at the prior day’s close. The overnight open was below the prior day’s value area. Price action went sideways in a 10-point range for most of the Asian session. The auction struggled to get back into the prior day’s value area, failing to accept above 4166.25. When the European session opened, supply began to liquidate and break down from the range. Sellers took out the bid at the prior day’s low as the auction fell below. Price rotated between the 1st and 2nd standard deviations south of VWAP as supply continued to push the bid lower. Inventory was short going into RTH with a cost basis of 4144, below the prior day’s low.
Regular Trading Hours (RTH) Session:
The RTH open gapped down beneath the prior day’s and T+2 low. There were no buyers in the IB period as supply pushed the markets lower. The bids near the lows from 5/16 and 5/17 were taken out. Price kept pushing lower until supply ran out at 4114, where a weak low was established. The short covering occurred several points above the gap up between 5/4 and 5/5, an area where sellers got trapped and have outstanding bids to close their position. $ES_F slowly rotated back up towards VWAP. After a failed attempt to establish above VWAP in I and J-period, sellers pushed the auction lower but failed to retest the weak low. In L and M-period, buyers pushed the auction up past the first standard deviation north of VWAP and a new RTH high, 4143.75. Sellers were able to absorb buyers and prevent any further climb into the RTH gap as M-period closed south of VWAP. However, the auction jumped 20-handles in the afterhours of N and O-period on strong Nvidia guidance and earnings. The O-period closed 2 standard deviations north of VWAP, trapping shorts.