
05/23/2023 Synopsis
Debt-ceiling fears send stocks south.

Market Overview

The S&P 500 was down in today’s session. 1/11 sectors were positive.
Outperforming Index: 🟢 Russell 2000 IWM 0.00%↑
Underperforming Index: 🔴 Nasdaq-100 QQQ 0.00%↑
Strongest Sector: 🟢 Energy XLE 0.00%↑
Weakest Sector: 🔴 Materials XLB 0.00%↑
Top Stock: 🟢 Moderna MRNA 0.00%↑
Poorest Stock: 🔴 Las Vegas Sands Corp LVS 0.00%↑
US Treasury yields retreated.
2-year: 🔴 4.26% (-6 bps)
📈 Here is the broad market overview as of the current day’s close.

S&P 500 Breakdown
📈 Here is a breakdown of the S&P 500 by sector, style and top holdings.

E-mini S&P 500 Top-Down Analysis
📈 Below are the monthly, weekly, daily and 4-hour charts for $ES_F.
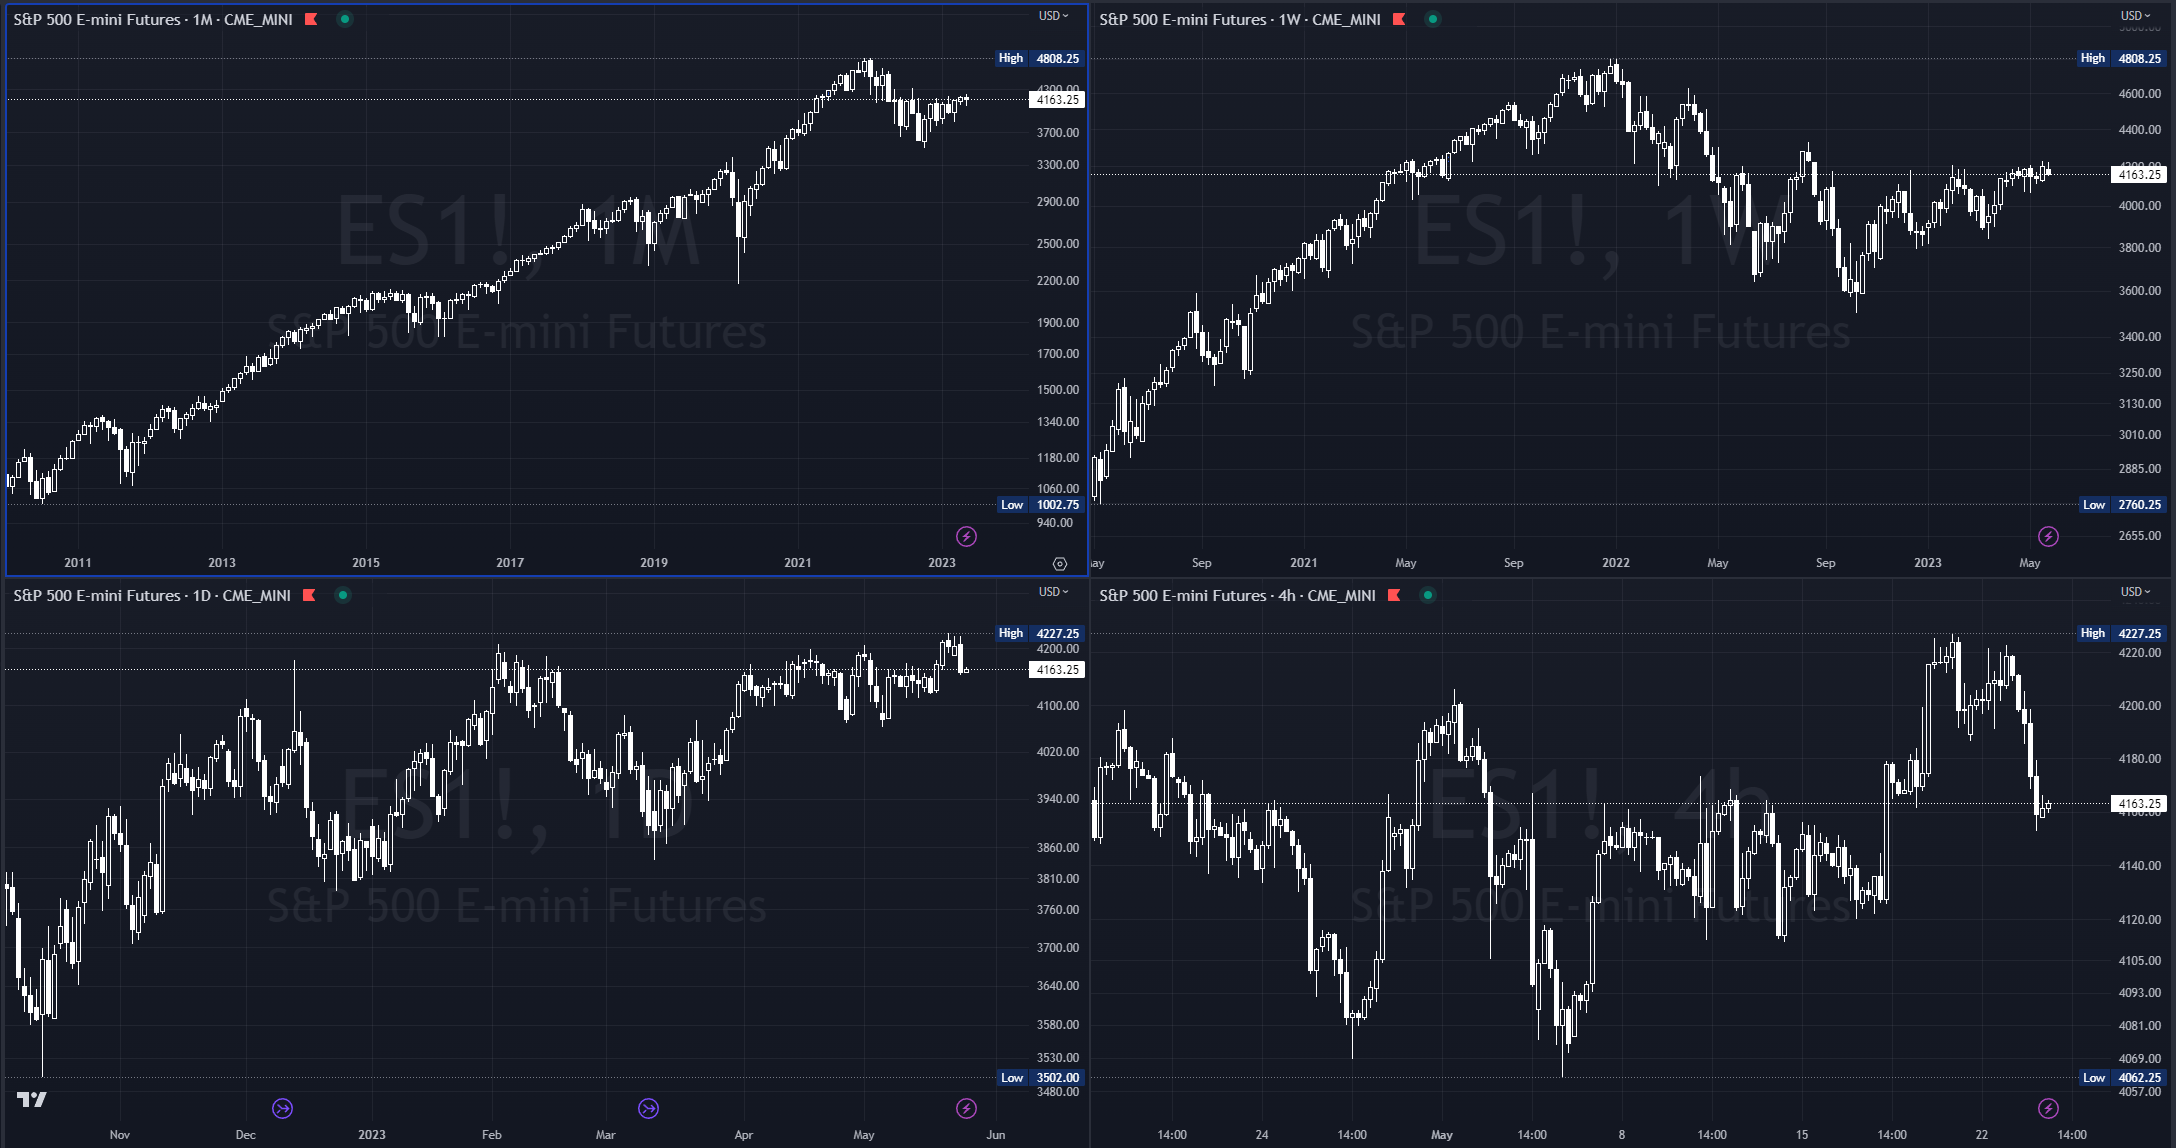
Monthly: 🟢 Higher low. [Nearest Low: 4068.75]
Weekly: 🟢 One time framing up. [Nearest low: 4120]
Daily: 🟡 Balance. [Last 4-days: 4153 - 4227.25]
E-mini S&P 500 Metrics
Recent Performance & Technicals


E-mini S&P 500 Volume Profile
ES ETH/RTH Split Volume Profile
📈 Here is a chart of the past few sessions with a daily ETH/RTH split Volume Profile:

ES VWAP/Volume Profile Levels

Session Recap
Electronic Trading Hours (ETH)
Overnight Session:
Wholesale was long at the prior day’s close. The overnight open was inside the prior day’s value area. A few hours into the Asian session, buyers were able to lift the offer past the prior day’s high. However, there was no follow-through with supply able to absorb demand leading to a reversal. Through the remainder of the Asian session and much of the European session, sellers were driving the bid lower. Buyers at the prior day’s low were completely consumed as price action broke below. Inventory during the overnight session was short going into RTH and making new Globex lows. VPOC was 4202 with buyers offsides.
Regular Trading Hours (RTH) Session:
The RTH open gapped down and was beneath the prior day’s low and T+2 low. The gap was quickly filled during A-period. Throughout the IB-period, price was fluctuating above and below the prior day’s low. The B-period high at 4198.50 ended up being the high of the day. Buyers were unable to fill the resting offers from trapped longs of the last few trading sessions. In G-period, $ES_F broke down below the A-period low and never got back into the IB range. The auction dropped 30-handles over the next 4 TPO periods. Eventually, the bid was found at 4153, inside the single prints from 5/17. Short covering stabilized $ES_F for the remainder of the day as it traded sideways in a 15-point channel into the close.