
05/17/2023 Synopsis
Equity markets rally amid optimism on debt-ceiling talks

Market Overview

The S&P 500 was up in today’s session. 9/11 sectors were positive.
Outperforming Index: 🟢 Russell 2000 IWM 0.00%↑
Underperforming Index: 🔴 S&P 500 SPY 0.00%↑
Strongest Sector: 🟢 Consumer discretionary XLY 0.00%↑
Weakest Sector: 🔴 Utilities XLU 0.00%↑
Top Stock: 🟢 Comerica Incorporated CMA 0.00%↑
Poorest Stock: 🔴 Aon plc AON 0.00%↑
US Treasury yields retreated.
2-year: 🔴 4.13% (-2.3 bps)
📈 Here is the broad market overview as of the current day’s close.

S&P 500 Breakdown
📈 Here is a breakdown of the S&P 500 by sector, style and top holdings.

E-mini S&P 500 Top-Down Analysis
📈 Below are the monthly, weekly, daily and 4-hour charts for $ES_F.

Monthly: 🟢 Higher low. [Nearest Low: 4068.75]
Weekly: 🟡 Balance / inside week. [Last 6-weeks: 4062.25 - 4206.25]
Daily: 🟢 Higher low and look above most recent balance zone. [Nearest low: 4122]
E-mini S&P 500 Metrics
Recent Performance & Technicals


E-mini S&P 500 Volume Profile
ES ETH/RTH Split Volume Profile
📈 Here is a chart of the past few sessions with a daily ETH/RTH split Volume Profile:

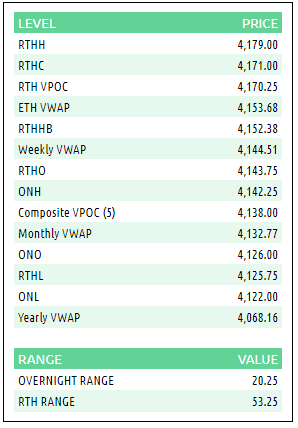
ES VWAP/Volume Profile Levels
Session Recap
Electronic Trading Hours (ETH)
Overnight Session:
Wholesale was short at the prior day’s close. The overnight open was below the prior day’s value area. The auction climbed during the first part of the Asian session to get back into the previous day’s value area. Supply was present near yesterday’s VPOC and a weak high double top was formed. $ES_F fell while wholesale searched for the bid. At 4122, 2-points from yesterday’s low, buyers absorbed supply and $ES_F rotated up above VWAP. Inventory during the overnight session was long going into RTH, with short traders caught offsides. Overnight VPOC was 4134.
Regular Trading Hours (RTH) Session:
The RTH open was above the prior day’s price range and inside the T+2 range. There was no gap between the previous day’s RTH range and the RTH open. Inventory sold off in A-period before exhausting at 4125.75, shy of the overnight low and previous day’s low. With liquidity in hand, buyers began to lift the offer and price beginning in B-period. This continued as buyers were able to absorb overhead supply led by strong demand in D through G-period. This resulted in $ES_F accepting above the A-high, overnight high, prior day’s and weekly high. At 4179, a few points above the May 2nd high, passive sellers were able to absorb buyers on the ask. $ES_F retraced from +2 standard deviations north of VWAP down to the +1 standard deviation area. $ES_F traded sideways into the close with a cost basis of 4170.25.