
05/12/2023 Synopsis
Declining consumer sentiment drags stocks.

Market Overview
The S&P 500 was down in Friday’s session. 7/11 sectors were positive.
Outperforming Index: 🟢 Dow Jones DIA 0.00%↑
Underperforming Index: 🔴 Nasdaq-100 QQQ 0.00%↑
Strongest Sector: 🟢 Utilities XLU 0.00%↑
Weakest Sector: 🔴 Consumer Discretionary XLY 0.00%↑
Top Stock: 🟢 First Solar FSLR 0.00%↑
Poorest Stock: 🔴 Gen Digital GEN 0.00%↑
US Treasury yields retreated.
2-year: 🔴 3.99% (-0.2 bps)
Events this week:

📈 Here is the broad market overview as of Friday’s close.

S&P 500 Breakdown
📈 Here is a breakdown of the S&P 500 by sector, style and top holdings.

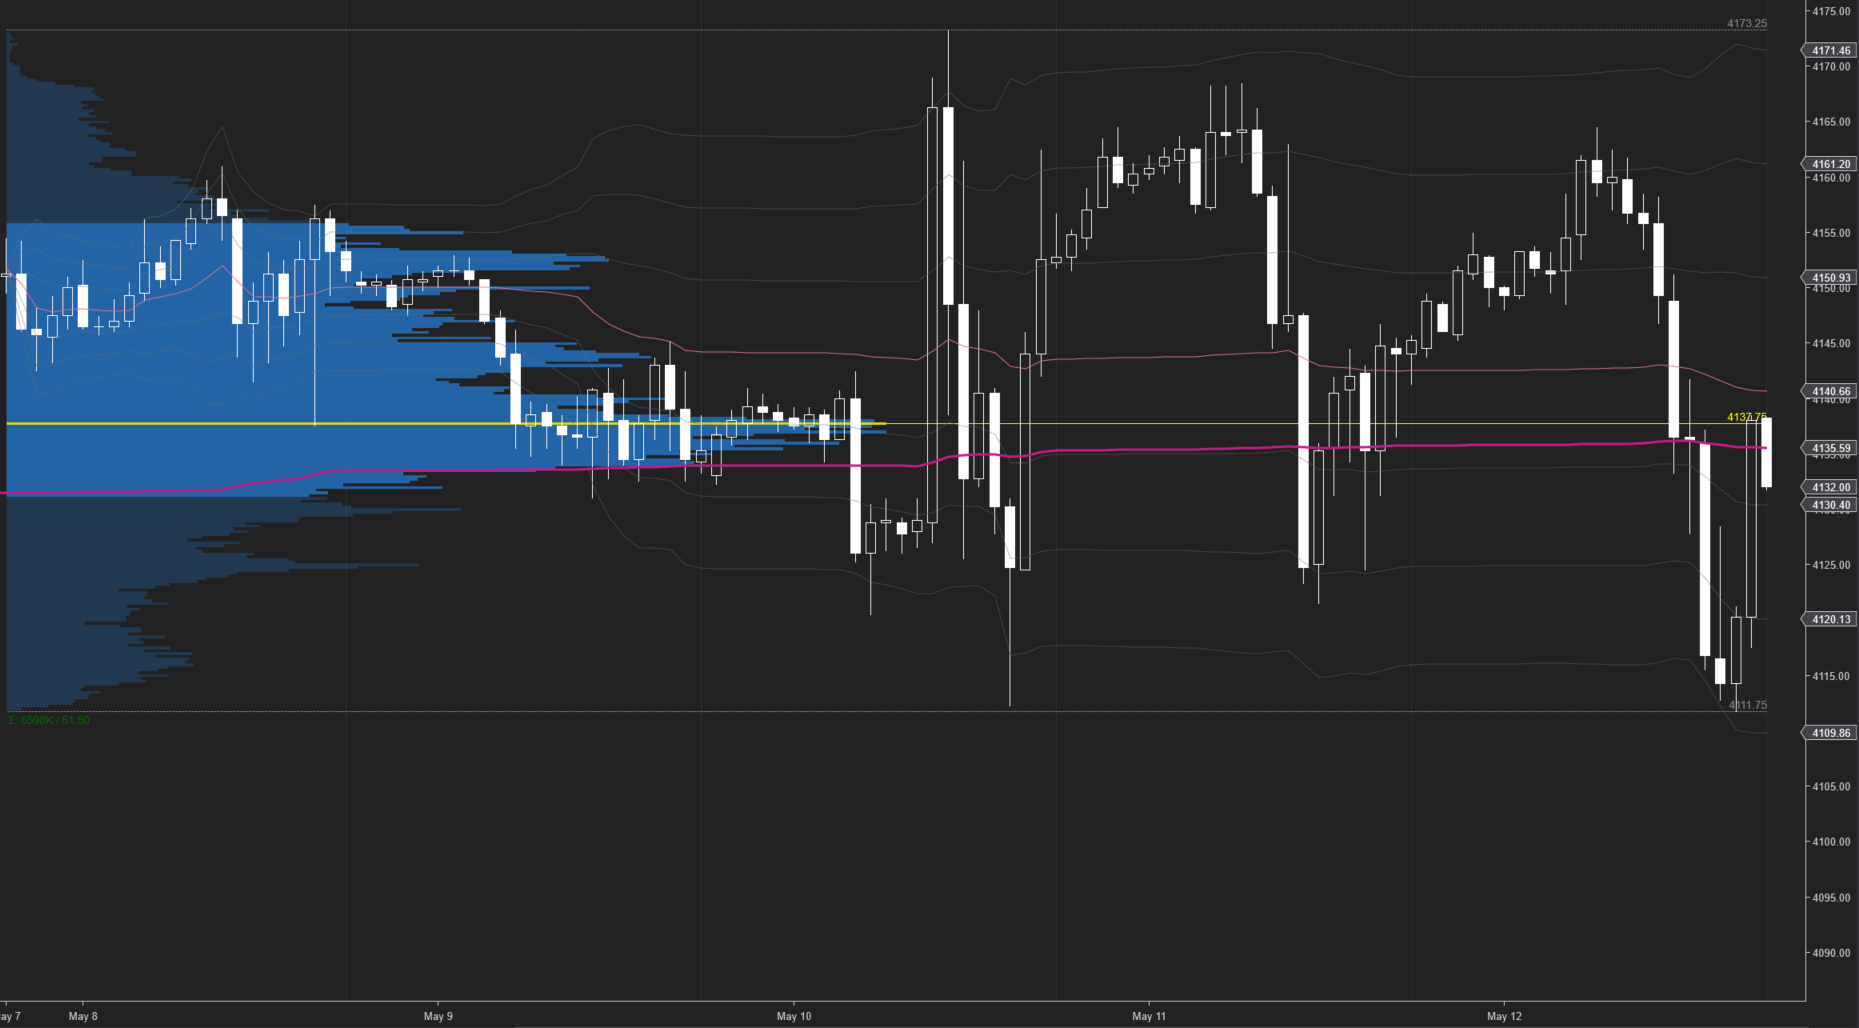
E-mini S&P 500 Top-Down Analysis
📈 Below are the monthly, weekly, daily and 4-hour charts for $ES_F.

Monthly: 🟢 Higher low. [Nearest Low: 4068.75]
Weekly: 🟡 Balance / inside week. [Last 6-weeks: 4062.25 - 4206.25]
Daily: 🔴 OTFD in a larger balance zone. [Nearest high: 4164.50]
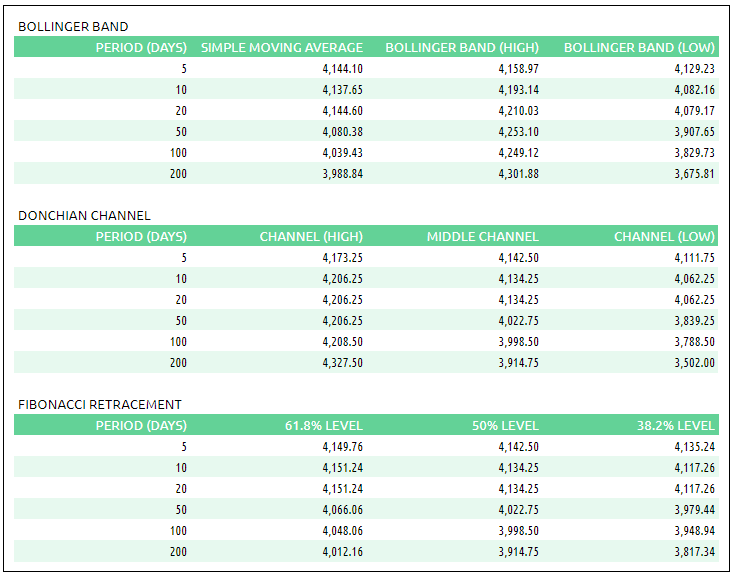
E-mini S&P 500 Metrics
Recent Performance & Technicals

E-mini S&P 500 Volume Profile
ES ETH/RTH Split Volume Profile
📈 Here is a chart of the past few sessions with a daily ETH/RTH split Volume Profile:

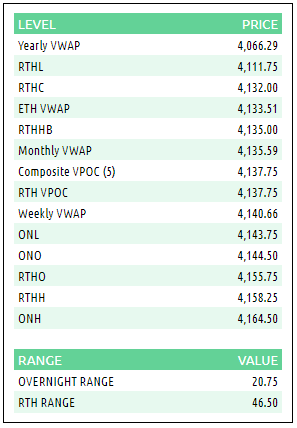
ES VWAP/Volume Profile Levels
Session Recap
Electronic Trading Hours (ETH)
Overnight Session:
Wholesale was short at the prior day’s close. The overnight open was just inside the prior day’s price range. There was no supply overnight. Buyers at 4143.75 absorbed supply and pushed the auction above the prior day’s high. It remained there for much of the Asian session and moved higher when the London session opened. At 4164.50, buyers were absorbed by passive offers and wholesale took the auction until RTH. Inventory during the overnight session was long. Overnight VPOC was 4156.50.
Regular Trading Hours (RTH) Session:
The RTH open gapped up above the prior day’s high and was inside the T+2 range. Supply outweighed buyers in the IB-period as price action filled the RTH gap down to the prior day’s high during A-period. In B-period, the auction continued to fall into the prior day’s trading range. The first three TPO periods were one time framing down before encountering buyers near the -2 standard deviation level south of VWAP. In F-period, supply was able to absorb the bid and push price lower along a downward sloping -2 standard deviation area. At 4111.75, a weak low double bottom was established as buyers were able to consume supply. This led to a late session rally that saw $ES_F get back into the prior day’s range and climb above VWAP momentarily. The RTH session closed above VWAP, near the RTH session’s VPOC, before falling back down to VWAP in O-period. The session ended slightly below the Globex, weekly and monthly-anchored VWAP’s.