
05/10/2023 Synopsis
Consumer inflation data helps push stocks higher.

Market Overview

The S&P 500 was up in Wednesday’s session. 7/11 sectors were positive.
Outperforming Index: 🟢 Nasdaq-100 QQQ 0.00%↑
Underperforming Index: 🔴 Dow Jones DIA 0.00%↑
Strongest Sector: 🟢 Technology XLK 0.00%↑
Weakest Sector: 🔴 Energy XLE 0.00%↑
Top Stock: 🟢 Akamai Technologies AKAM 0.00%↑
Poorest Stock: 🔴 Axon Enterprise AXON 0.00%↑
US Treasury yields were mixed.
2-year: 🟡 3.91% (0.0 bps)
📈 Here is the broad market overview as of the Wednesday’s close.

S&P 500 Breakdown
📈 Here is a breakdown of the S&P 500 by sector, style and top holdings.

E-mini S&P 500 Top-Down Analysis
📈 Below are the monthly, weekly, daily and 4-hour charts for $ES_F.
Monthly: 🟢 Higher low. [Nearest Low: 4068.75]
Weekly: 🟡 Outside week. [Last 5-weeks: 4062.25 - 4206.25]
Daily: 🟡 Outside day. [Last 3-days: 4112.25 - 4173.25]
E-mini S&P 500 Metrics
Recent Performance & Technicals

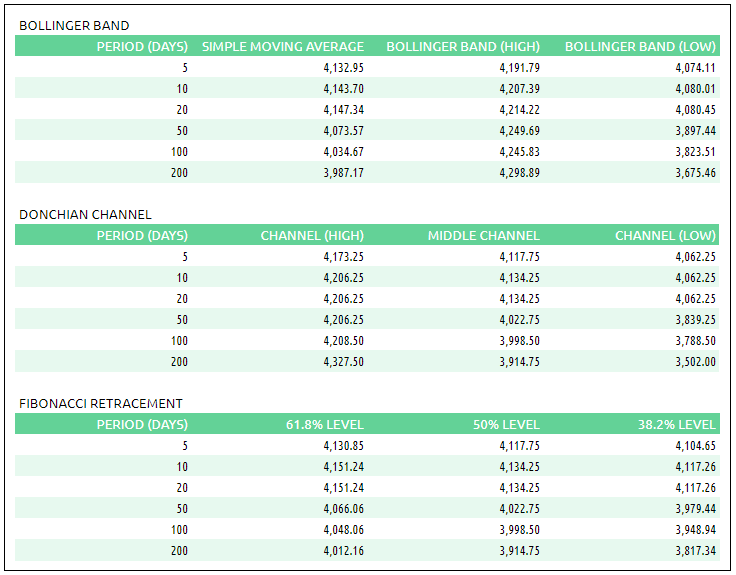
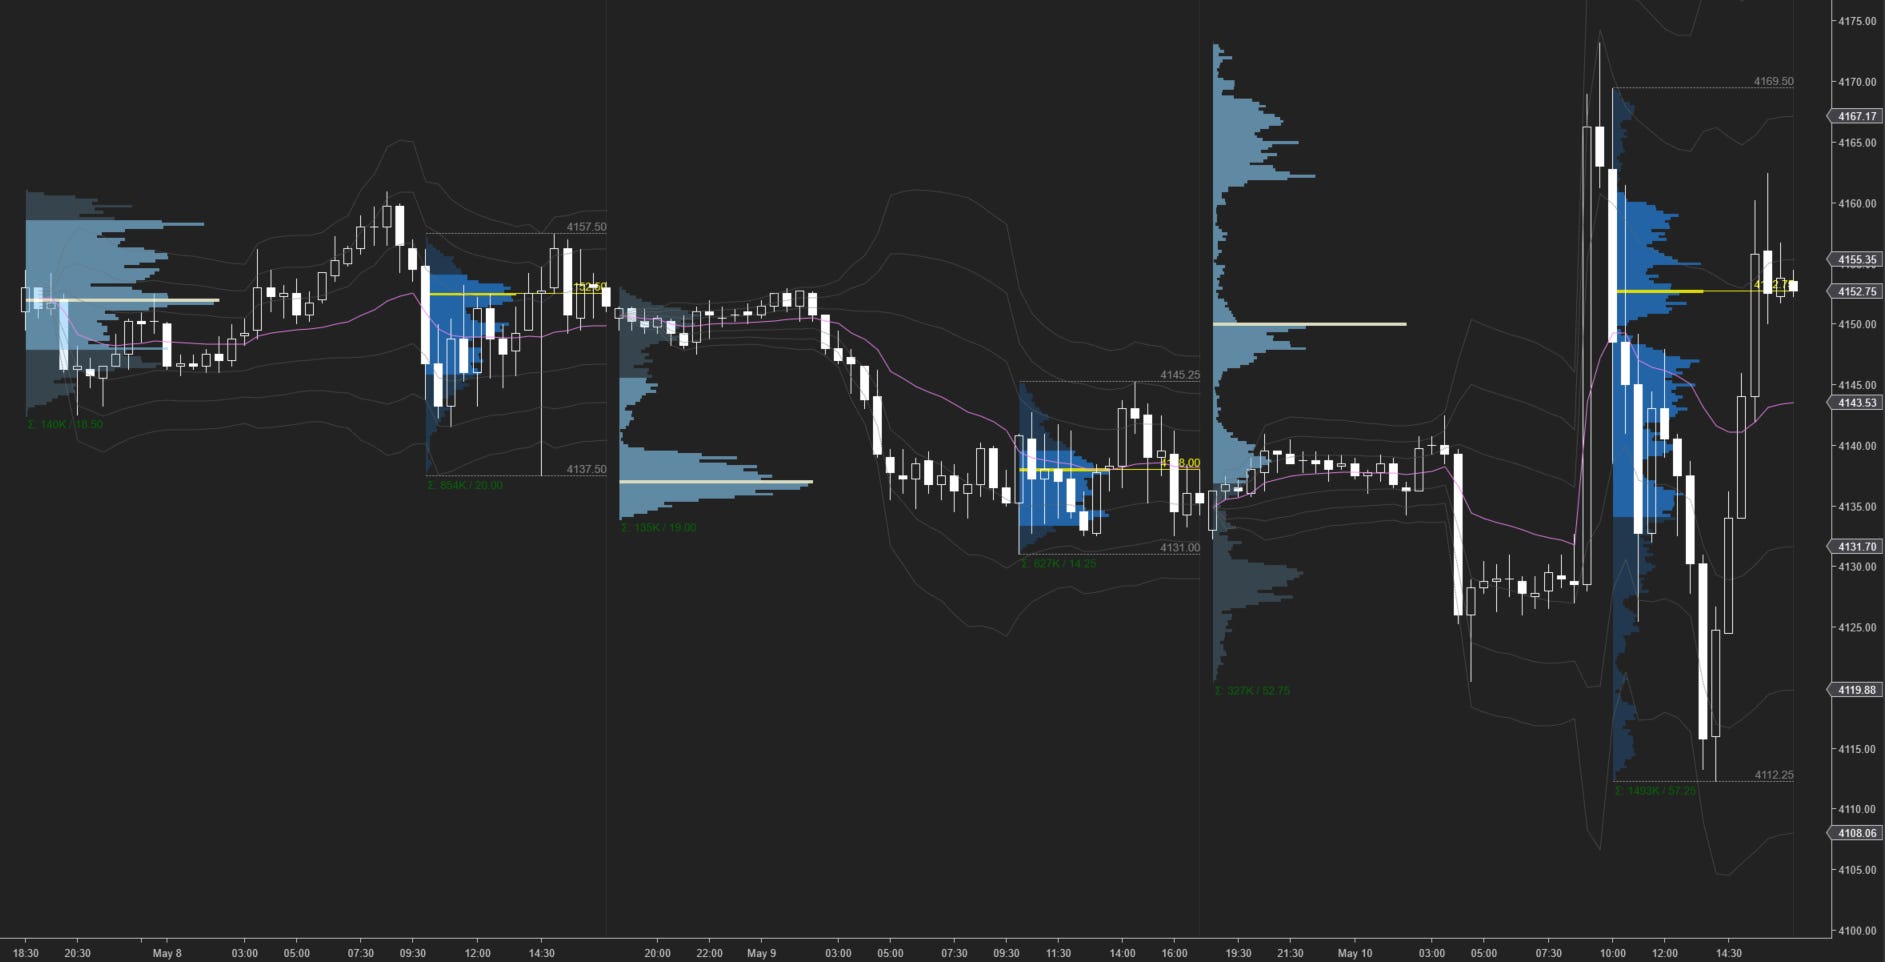
E-mini S&P 500 Volume Profile
ES ETH/RTH Split Volume Profile
📈 Here is a chart of the past few sessions with a daily ETH/RTH split Volume Profile:
ES VWAP/Volume Profile Levels

Session Recap
Electronic Trading Hours (ETH)
Overnight Session:
Wholesale was short at the prior day’s close. The overnight open was below the prior day’s value area. The Asian session was mostly flat. When London opened, supply overwhelmed buyers and the auction fell beneath the prior day’s low. At 4120.50, three standard deviations below VWAP, supply was absorbed by buyers and the auction stabilized. When CPI came in lower than anticipated, all equity futures rapidly moved higher. $ES_F rose about 40-handles to trade at new overnight session highs and above the prior day’s high. Inventory going into RTH was long. Overnight VPOC was 4150.
Regular Trading Hours (RTH) Session:
The RTH open was above the prior day’s price range and above the T+2 high. There was a gap up between the previous day’s RTH range and the RTH open. Once RTH opened, there was a retest of the overnight high. This fell short by several points as supply at 4169.50 could not be absorbed. This resulted in a fall from +2 standard deviations above VWAP down to the -1 standard deviation level and a fill of the RTH gap. In B-period, there was another false rally which couldn’t accept above the +1 standard deviation level and come anywhere near the A-period high. Sellers pushed the bid lower in C-period as $ES_F traded below the prior day’s low and the weekly and monthly-anchored VWAP’s. There was a bid at 4125.50 where shorts came in to cover and stabilized the auction. Buyers took the auction back above the weekly-VWAP before disappearing as sellers continued to move the bid lower. The bids at the C-period low and overnight low were taken out during a strong selloff in H-period. At 4112.25, short covering absorbed sellers and sparked a 50-point rally higher. Buyers couldn’t take out the sellers at 4162.50. The RTH session and O-period close were still above the prior day’s high and the weekly-anchored VWAP.