
05/09/2023 Synopsis
Stocks sink ahead of April inflation data; Debt ceiling clock is ticking.

Market Overview

The S&P 500 was down in Tuesday’s session. 2/11 sectors were positive.
Outperforming Index: 🟢 Dow Jones DIA 0.00%↑
Underperforming Index: 🔴 Nasdaq-100 QQQ 0.00%↑
Strongest Sector: 🟢 Industrials XLI 0.00%↑
Weakest Sector: 🔴 Materials XLB 0.00%↑
Top Stock: 🟢 DaVita Inc DVA 0.00%↑
Poorest Stock: 🔴 PayPal Holdings PYPL 0.00%↑
US Treasury yields were mixed.
2-year: 🟢 4.04% (+1.7 bps)
📈 Here is the broad market overview as of the Tuesday’s close.

S&P 500 Breakdown
📈 Here is a breakdown of the S&P 500 by sector, style and top holdings.

E-mini S&P 500 Top-Down Analysis
📈 Below are the monthly, weekly, daily and 4-hour charts for $ES_F.

Monthly: 🟢 Higher low. [Nearest Low: 4068.75]
Weekly: 🟡 Outside week. [Last 5-weeks: 4062.25 - 4206.25]
Daily: 🟡 Balance. [Last 5-days: 4062.25 - 4167]
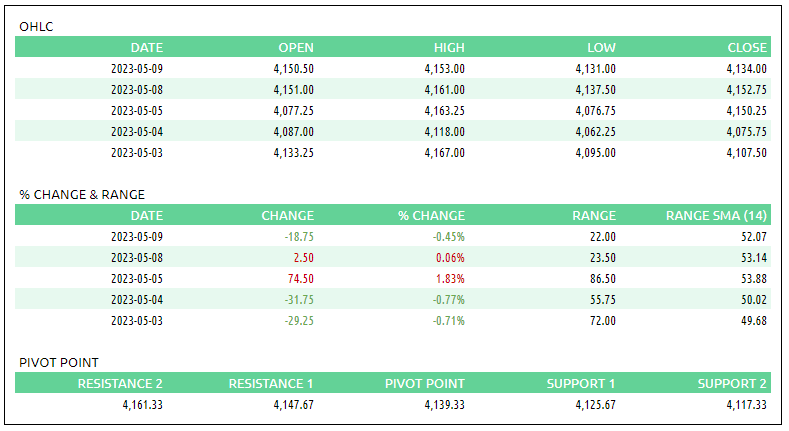
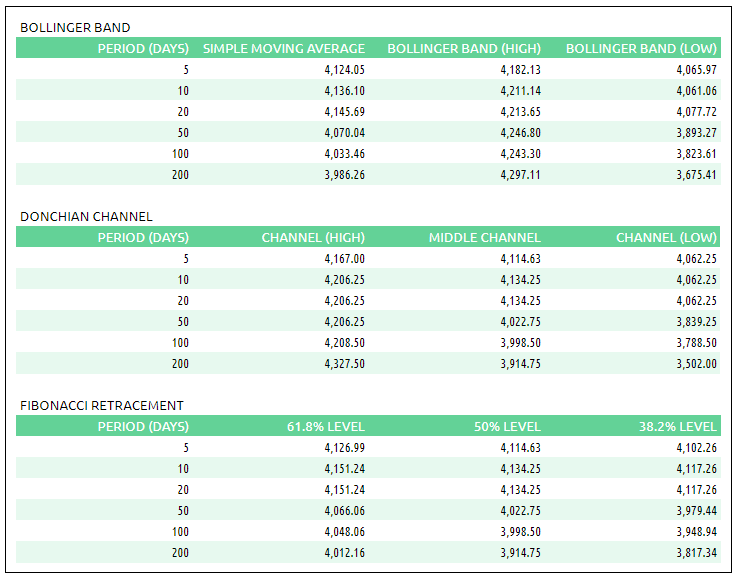
E-mini S&P 500 Metrics
Recent Performance & Technicals
E-mini S&P 500 Volume Profile
ES ETH/RTH Split Volume Profile
📈 Here is a chart of the past few sessions with a daily ETH/RTH split Volume Profile:

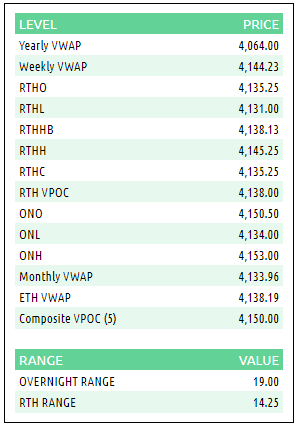
ES VWAP/Volume Profile Levels
Session Recap
Electronic Trading Hours (ETH)
Overnight Session:
Wholesale was long at the prior day’s close. The overnight open was inside the prior day’s value area. The auction was flat during the Asian session. Heading into the London open, supply started to liquidate and $ES_F slid nearly 20-points. It got beneath the prior day’s low and settled into a 6 to 7-point range slightly above the monthly-anchored VWAP. Inventory going into RTH was well short with overnight VPOC at 4137.
Regular Trading Hours (RTH) Session:
The RTH open gapped down and was below the prior day’s price range and inside the T+2 range. The RTH gap was immediately filled during A-period. The RTH session was rangebound with all price action inside a 15-point zone from 4131 to 4145.25. There was a lack of conviction from both buyers and sellers ahead of tomorrow’s CPI print. The auction rotated from two standard deviations below VWAP to two standard deviations above VWAP.