
05/05/2023 Synopsis
Jobs data pushes stocks higher.

Market Overview

The S&P 500 was up in Friday’s session. 11/11 sectors were positive.
Outperforming Index: 🟢 Russell 2000 $IWM
Underperforming Index: 🔴 Dow Jones $DIA
Strongest Sector: 🟢 Energy $XLE
Weakest Sector: 🔴 Utilities $XLU
Top Stock: 🟢 Zions Bancorporation $ZION
Poorest Stock: 🔴 Bio-Rad Laboratories $BIO
US Treasury yields were mixed.
2-year: 🟢 3.92% (+0.6 bps)
Events this week:

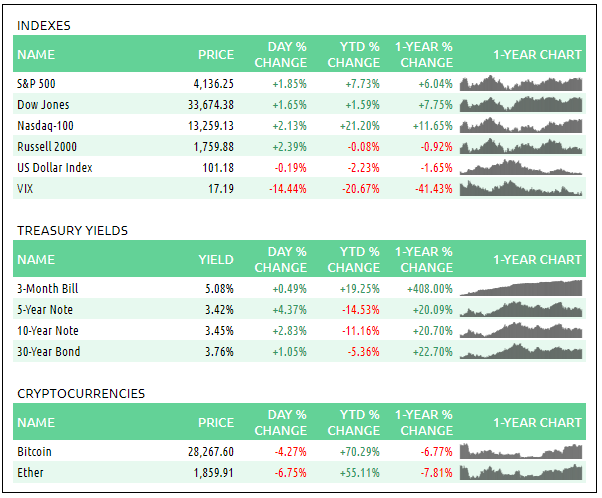
📈 Here is the broad market overview as of the Friday’s close.
S&P 500 Breakdown
📈 Here is a breakdown of the S&P 500 by sector, style and top holdings.

E-mini S&P 500 Top-Down Analysis
📈 Below are the monthly, weekly, daily and 4-hour charts for $ES_F.

Monthly: 🟢 Higher low. [Nearest Low: 4068.75]
Weekly: 🟡 Outside week. [Last 5-weeks: 4062.25 - 4206.25]
Daily: 🟡 Balance. [Last 3-days: 4062.25 - 4167]
E-mini S&P 500 Metrics
Recent Performance & Technicals


E-mini S&P 500 Volume Profile
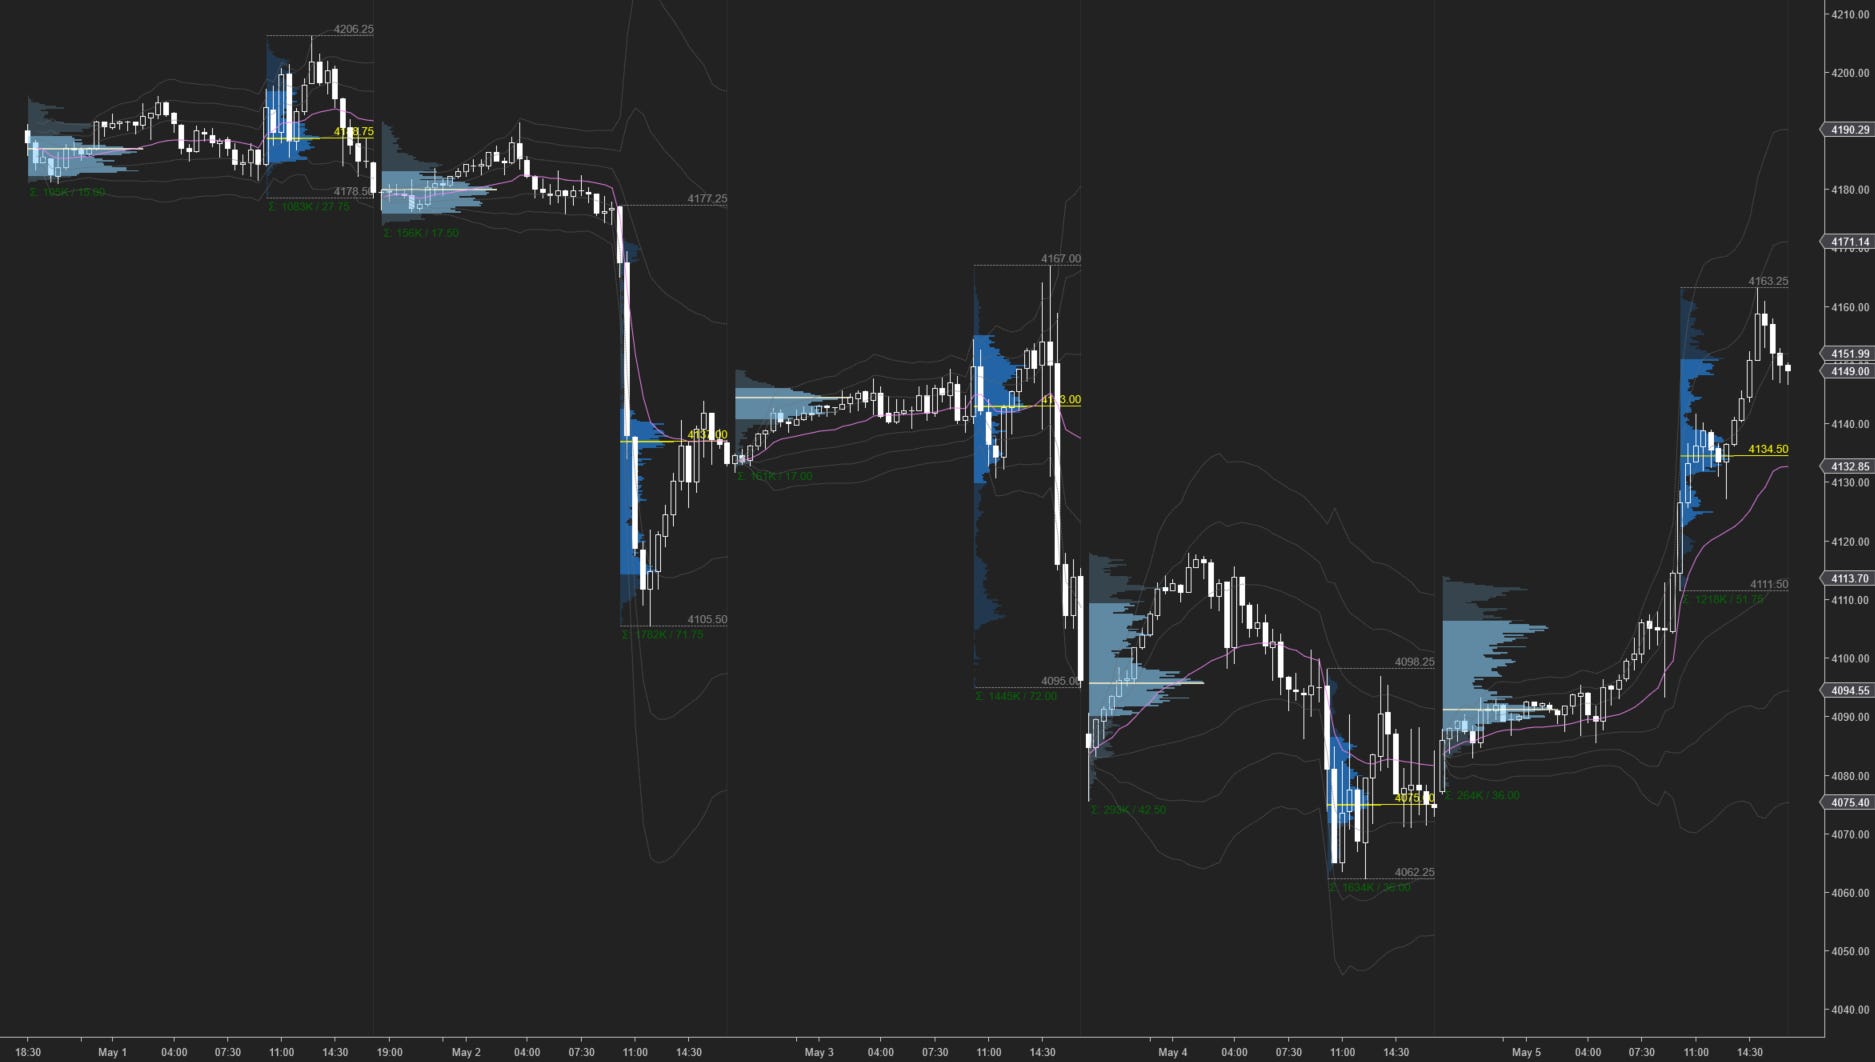
ES ETH/RTH Split Volume Profile
📈 Here is a chart of the past few sessions with a daily ETH/RTH split Volume Profile:
ES VWAP/Volume Profile Levels

Session Recap
Electronic Trading Hours (ETH)
Overnight Session:
Wholesale was short at the prior day’s close. The overnight open was inside the prior day’s value area. There was no supply overnight and inventory during the was 100% long. The auction couldn’t take the bid below 4076.75 and slowly climbed above the prior day’s high. Price action reached two standard deviations above VWAP and moved north from -2 to -1 standard deviations below the weekly/monthly VWAP’s. When the NFP jobs report was released, inventory corrected back below VWAP before drying up and continuing long. $ES_F was making new overnight highs going into RTH and overnight VPOC was 4091.
Regular Trading Hours (RTH) Session:
The RTH open gapped up and was above the prior day’s high and inside the T+2 range. There was no supply at the open as $ES_F was able to trade north of the overnight high in A-period. Periods A through C were one time framing up as the auction climbed above the weekly/monthly VWAP. There was supply at 4141.75 and $ES_F traded sideways for several periods. Once that supply was absorbed, buyers were able to lift the offer and the auction made higher lows in G through L-period. At 4163.25, two standard deviations north of VWAP, overhead supply held steady and buyers faded. Wholesale backfilled and took profit for the remainder of the session but RTH still ended near the +1 standard deviation area. The 4163 to 4167 area is one to watch as there’s supply from a prior balance zone (4176 to 4206) above it.