Market Overview
The S&P 500 was down in today’s session. 2/11 sectors were positive.
Outperforming Index: 🟢 Nasdaq-100 QQQ 0.00%↑
Underperforming Index: 🔴 Russell 2000 IWM 0.00%↑
Strongest Sector: 🟢 Real estate XLRE 0.00%↑
Weakest Sector: 🔴 Communications XLC 0.00%↑
Top Stock: 🟢 Ball Corporation BALL 0.00%↑
Poorest Stock: 🔴 Paramount Global PARA 0.00%↑
US Treasury yields retreated.
2-year: 🔴 3.79% (-0.4 bps)
📈 Here is the broad market overview as of the current day’s close.
S&P 500 Breakdown
📈 Here is a breakdown of the S&P 500 by sector, style and top holdings.
E-mini S&P 500 Top-Down Analysis
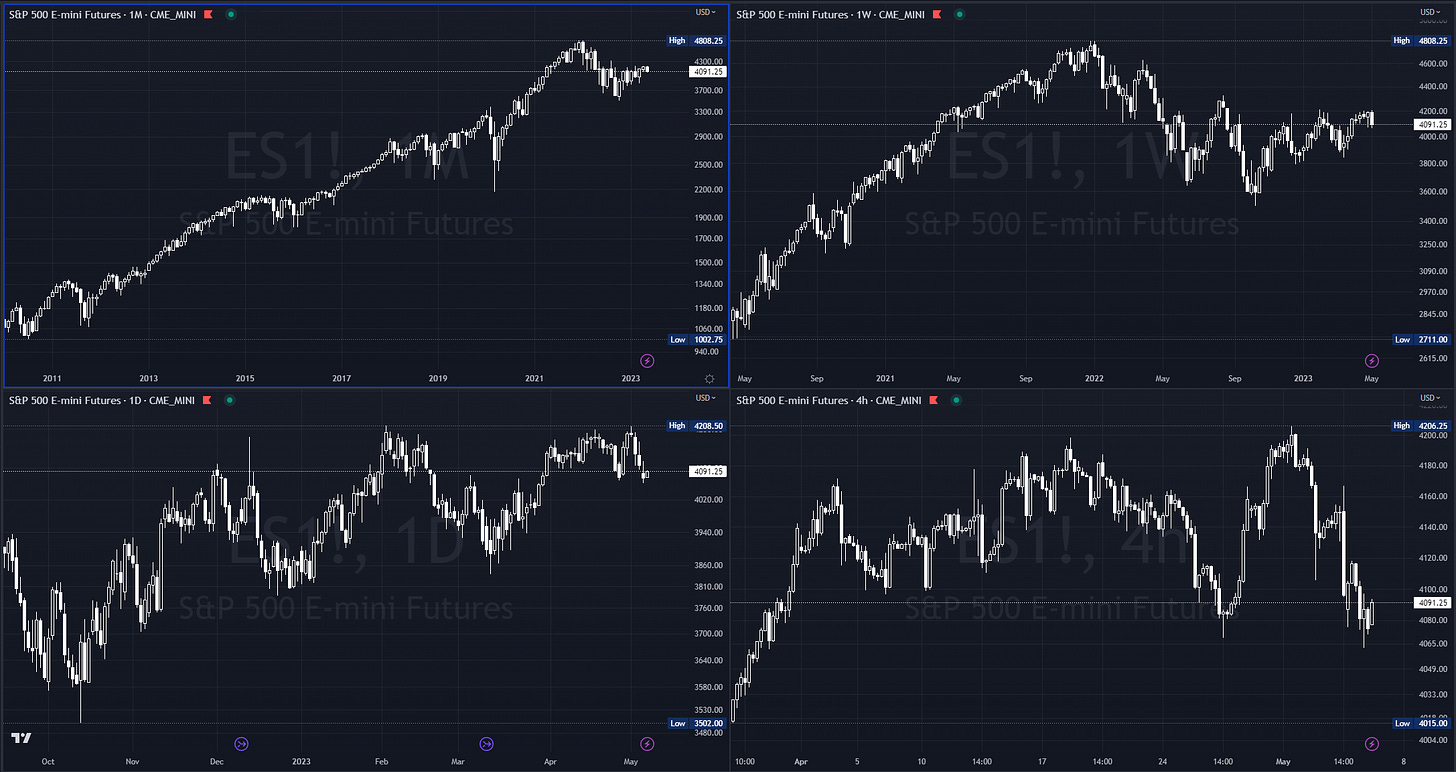
📈 Below are the monthly, weekly, daily and 4-hour charts for $ES_F.
Monthly: 🟢 Higher low. [Nearest Low: 4068.75]
Weekly: 🟡 Balance. [Last 4-weeks: 4068.75 - 4198.25]
Daily: 🔴 One time framing down. [Nearest high: 4062.25]
E-mini S&P 500 Metrics
Recent Performance & Technicals
E-mini S&P 500 Volume Profile
ES ETH/RTH Split Volume Profile
📈 Here is a chart of the past few sessions with a daily ETH/RTH split Volume Profile:
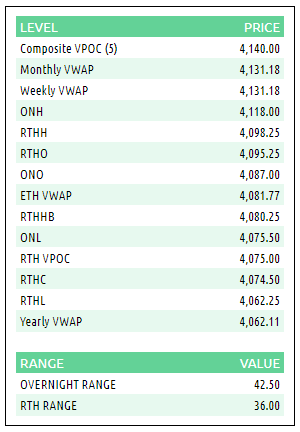
ES VWAP/Volume Profile Levels
Session Recap
Electronic Trading Hours (ETH)
Overnight Session:
Wholesale was short at the prior day’s close. The overnight open was below the prior day’s low. When the Asian session opened, wholesale liquidated until they found the bid at 4075.50. Buyers stepped in, lifted the offer to move the auction back into the prior day’s trading range. At 4118, nearly 2 standard deviations north of VWAP, there was supply plus limited follow-through from buyers. As a result, $ES_F reversed south but failed to retest the previous overnight lows before flattening out. Going into RTH, inventory was flat. Overnight VPOC was 4095.50.
Regular Trading Hours (RTH) Session:
The RTH open was one tick inside the prior day’s price range and below the T+2 low. There was no gap between the previous day’s RTH range and the RTH open. Right at the open, there was a lack of demand. The auction fell in the IB period as supply erased the overnight and previous day’s low. When the auction reached 2 standard deviations below VWAP, shorts covered. In C and D-period, buyers failed to take back losses from the opening hour and couldn’t get back into the previous day’s range. Sellers pushed the auction down again. The C-period low was violated by 5-ticks but supply was absorbed at 4062.25, the yearly VWAP. Buyers immediately hit the offer and moved $ES_F 35 points north. Buyers couldn’t reclaim the A-period high and the auction rotated between the +1 and -1 standard deviation levels for the remainder of RTH. $ES_F closed underneath VWAP with long traders upside down. It was the lowest close for $ES_F since 3/31.


