
04/25/2023 Synopsis
Declining consumer confidence drags stocks lower.

Market Overview

The S&P 500 was down in today’s session. 0/11 sectors were positive.
Outperforming Index: 🟢 Dow Jones DIA 0.00%↑
Underperforming Index: 🔴 Russell 2000 IWM 0.00%↑
Strongest Sector: 🟢 Utilities XLU 0.00%↑
Weakest Sector: 🔴 Materials XLB 0.00%↑
Top Stock: 🟢 Brown & Brown BRO 0.00%↑
Poorest Stock: 🔴 First Republic Bank FRC 0.00%↑
US Treasury yields retreated.
2-year: 🔴 3.96% (-13.5 bps)

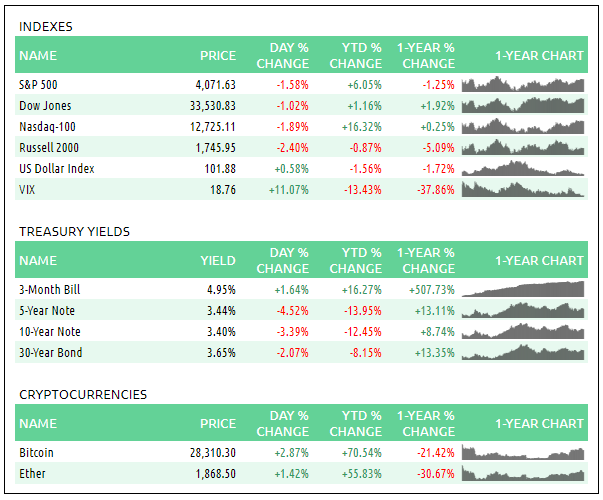
📈 Here is the broad market overview as of the current day’s close.
S&P 500 Breakdown
📈 Here is a breakdown of the S&P 500 by sector, style and top holdings.

E-mini S&P 500 Top-Down Analysis
📈 Below are the monthly, weekly, daily and 4-hour charts for $ES_F.

Monthly: 🟡 Balance / consolidation. [Last 4-months: 3788.50 - 4208.50]
Weekly: 🟢 One time framing up / higher lows. [Nearest low: 4135.25]
Daily: 🔴 One time framing down in a larger balance zone. [Nearest high: 4158.50]
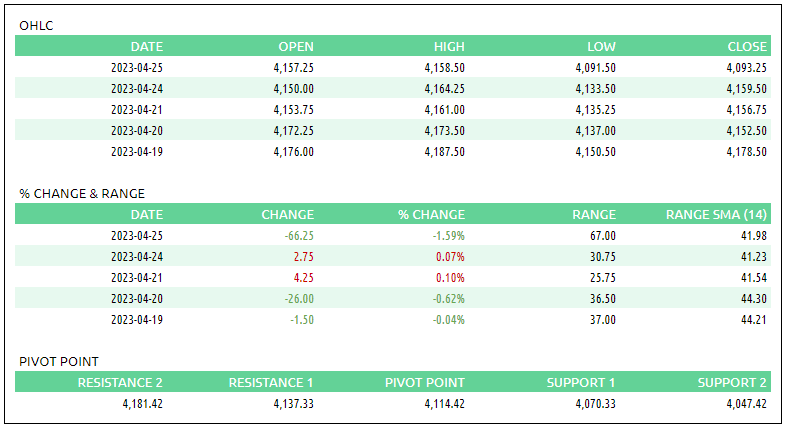
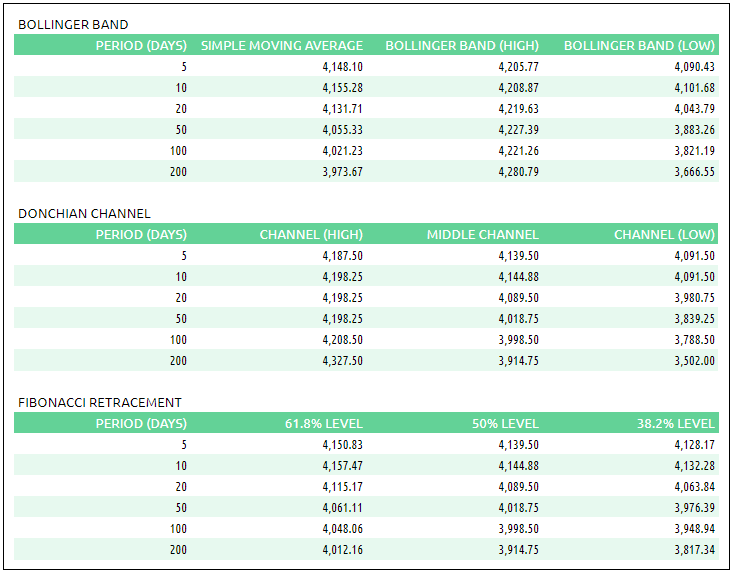
E-mini S&P 500 Metrics
Recent Performance & Technicals
E-mini S&P 500 Volume Profile
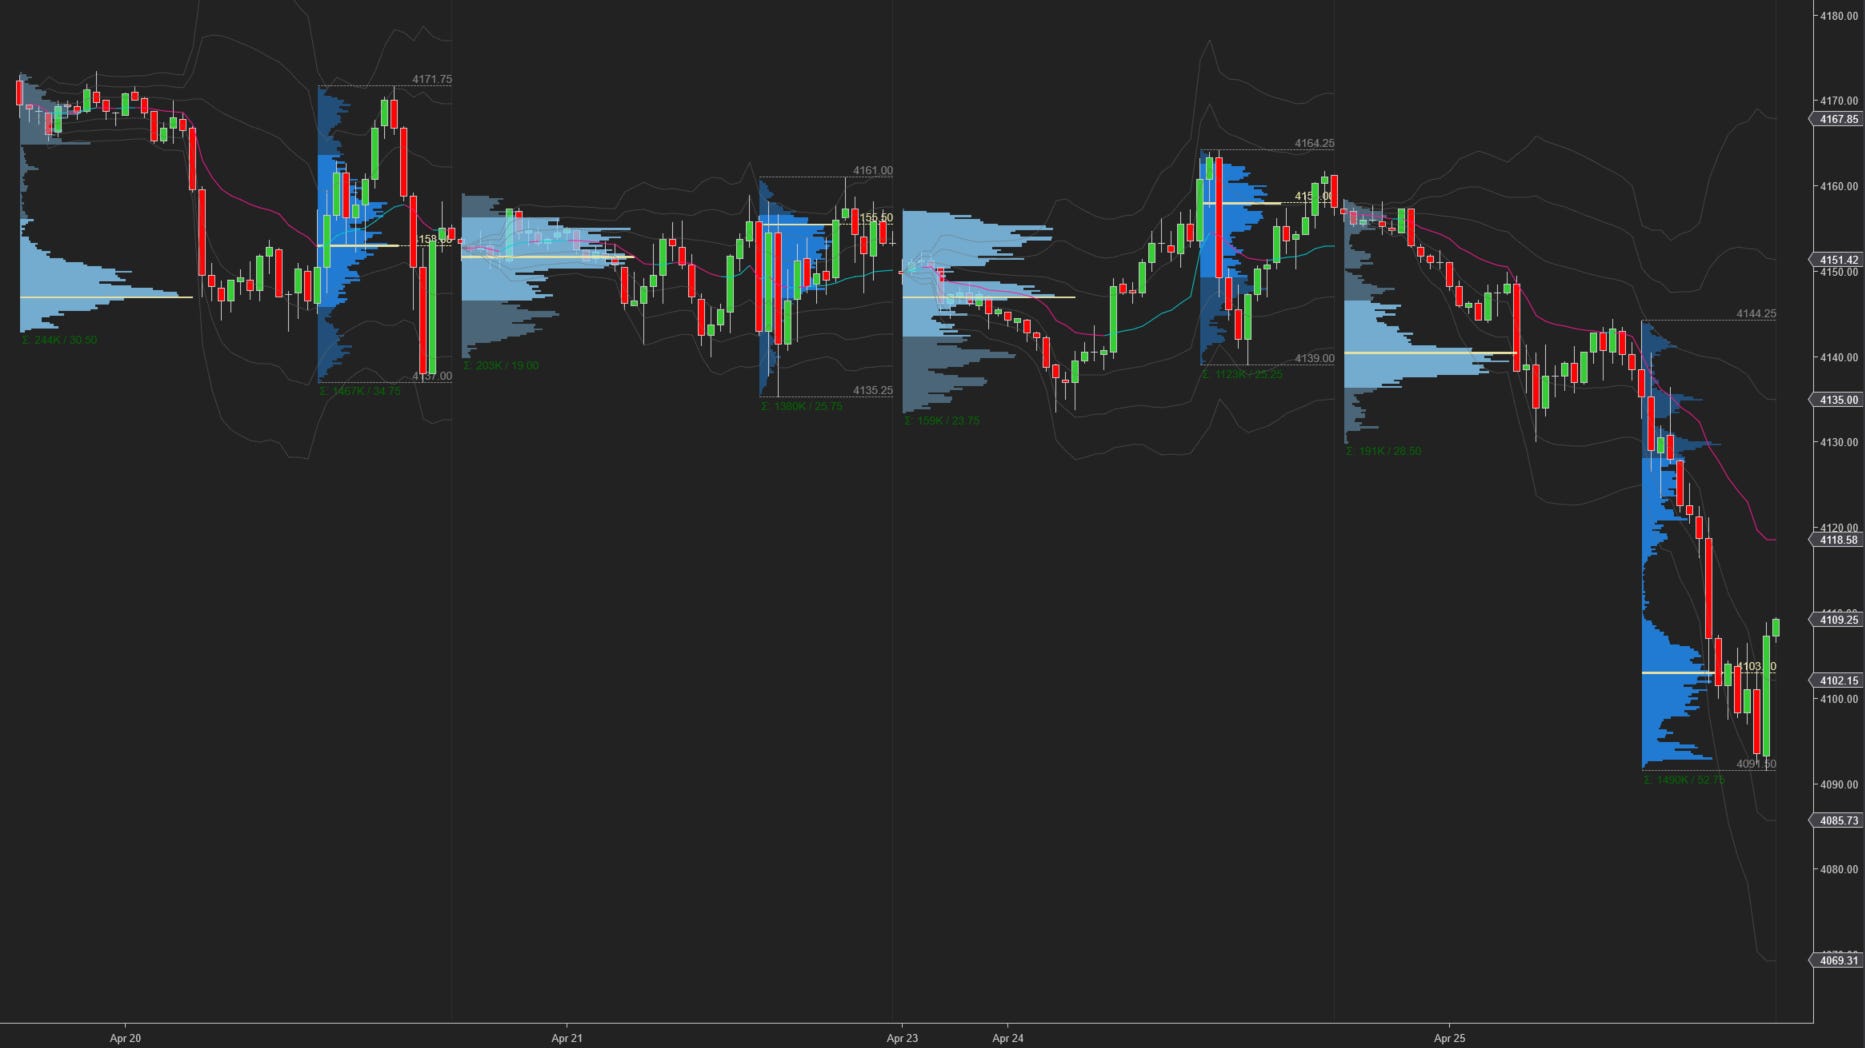
ES ETH/RTH Split Volume Profile
📈 Here is a chart of the past few sessions with a daily ETH/RTH split Volume Profile:
ES VWAP/Volume Profile Levels

Session Recap
Electronic Trading Hours (ETH)
Overnight Session:
Wholesale was long at the prior day’s close. The overnight open was inside the prior day’s value area. In the two periods after the NYSE close, inventory was marked down. Trapped supply above 4158.50, absorbed demand early on in the Japan session. Buyers thinned out and supply liquidated to drive $ES_F below the prior day’s value area. When the London session opened, the auction continued to sell off with wholesale in search of bidders. $ES_F sank below the low from the prior day until passive buyers absorbed supply at 4130, two standard deviations below VWAP. The short covering stabilized the auction and price resumed trading near the bottom of the prior day’s range. As Inventory during the overnight session was very short and VPOC was 4140.50.
Regular Trading Hours (RTH) Session:
The RTH open gapped down by 2-ticks from the prior day’s low and was inside the T+2 range. The overnight gap was closed early on as inventory corrected during A-period. During the IB period, the auction couldn’t accept above VWAP leading to a rotation downward that broke the overnight low. Other than a responsive bid during C and D-period, which drove the auction to retest VWAP with acceptance in the overnight range, the remainder of the day lacked any demand. $ES_F trended down along the negative sloping minus two standard deviation level on its way to erasing every prior RTH low for the month of April. Supply was finally absorbed in N-period at 4091.50, a few points above the 3/31 RTH low (4088.50). Short covering pushed $ES_F back above the 4100 level where it ended the ETH session (O-period) 15-handles higher than RTH (M-period). Today was a double distribution day with single prints in H-period (4107.50 to 4116.50) which left long traders trapped.