
04/21/2023 Synopsis
S&P manufacturing data and corporate earnings push stocks higher to end the week.

Market Overview

The S&P 500 was up in Friday’s session. 6/11 sectors were positive.
Outperforming Index: 🟢 Nasdaq-100 QQQ 0.00%↑
Underperforming Index: 🔴 Dow Jones DIA 0.00%↑
Strongest Sector: 🟢 Consumer discretionary XLY 0.00%↑
Weakest Sector: 🔴 Materials XLB 0.00%↑
Top Stock: 🟢 Baxter International BAX 0.00%↑
Poorest Stock: 🔴 Albemarle Corp ALB 0.00%↑
US Treasury yields advanced.
2-year: 🟢 4.18% (+4.1 bps)

📈 Here is the broad market overview as of the current day’s close.

S&P 500 Breakdown
📈 Here is a breakdown of the S&P 500 by sector, style and top holdings.

E-mini S&P 500 Top-Down Analysis
📈 Below are the monthly, weekly, daily and 4-hour charts for $ES_F.

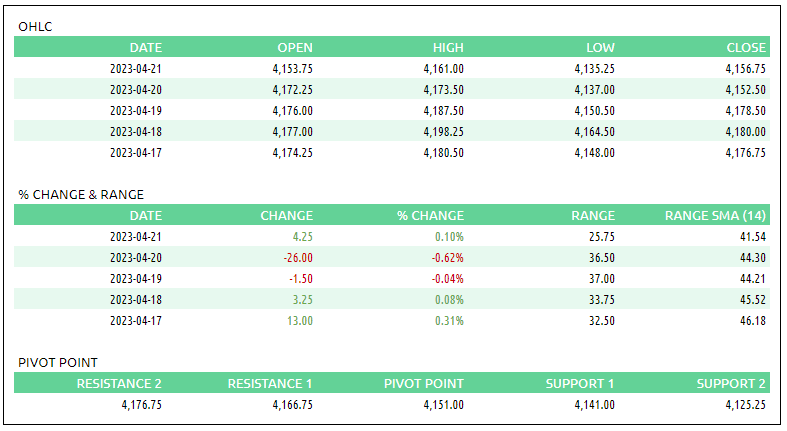
Monthly: 🟡 Balance / consolidation. [Last 4-months: 3788.50 - 4208.50]
Weekly: 🟢 One time framing up / higher lows. [Nearest low: 4135.25]
Daily: 🟡 Balance / consolidation. [Last 6-days: 4135.25 - 4198.25]
E-mini S&P 500 Metrics
Recent Performance & Technicals

E-mini S&P 500 Volume/Market Profile
ES Composite Volume Profile
📈 Here is a chart of the past few sessions with a 5-day composite ETH Volume Profile:

ES ETH/RTH Split Volume Profile
📈 Here is a chart of the past few sessions with a daily ETH/RTH split Volume Profile:

ES Market/Volume Profile Levels

Session Recap
Electronic Trading Hours (ETH)
Overnight Session:
Wholesale was short at the prior day’s close. The overnight open was inside the prior day’s value area. Price action was rangebound during much of the Asian session inside a 10-point channel. Inventory during the overnight session was long | short | rangebound. Buyers couldn’t lift the offer above 4157.50, a few ticks from the top of the prior day’s N-period spike. Just prior to London opening, supply pushed the auction to new session lows, falling to 3 standard deviations below VWAP. Responsive buyers pushed $ES_F back up over VWAP before supply liquidated again to bring the auction back down to new lows. Supply got absorbed at 4140, where 301 contracts were traded on the bid before buyers spurred a rotation upwards. The prior day’s high held up and overnight VPOC was 4151.75. Wholesale’s inventory was long heading into RTH and made new session highs at 4159.
Regular Trading Hours (RTH) Session:
The RTH open was inside the prior day’s value area and below the T+2 low. There was no gap between the previous day’s RTH range and the RTH open. When the opening bell sounded at the NYSE, $ES_F fell to three standard deviations below VWAP during A and B-period, taking out the overnight low. Supply failed to take out passive bids from trapped shorts at 4137.75. This resulted in a 20-point rally in B-period which set up an outside candle. The overnight high held up as supply was encountered at 4158.25. In the C-period, responsive sellers hit the bid and dropped the auction for a 23-point loss, erasing the B-period low and prior day’s low. From A through C-period, $ES_F round-tripped three times and covered 60+ points. At 4135.25, outside the third standard deviation below VWAP, trapped shorts covered again and sparked another climb back into the prior day’s range. Buyers eventually chewed through supply en route to accepting above VWAP and momentarily exceeding three standard deviations above VWAP. $ES_F took out the overnight high, before trapped long supply absorbed demand at 4161, three standard deviations above VWAP. Wholesale backfilled but buyers stepped in and kept the auction above VWAP into the close. Despite the volatility and the auction rotating back and forth, $ES_F finished flat on the day, only 2-ticks below the prior day’s close in O-period.