
04/19/2023 Synopsis
Equities were mixed again as more corporate earnings roll in.

Market Overview

The S&P 500 was down in today’s session. 4/11 sectors were positive.
Outperforming Index: 🟢 Russell 2000 IWM 0.00%↑
Underperforming Index: 🔴 Dow Jones DIA 0.00%↑
Strongest Sector: 🟢 Utilities XLU 0.00%↑
Weakest Sector: 🔴 Communications XLC 0.00%↑
Top Stock: 🟢 First Republic Bank FRC 0.00%↑
Poorest Stock: 🔴 CDW Corporation CDW 0.00%↑
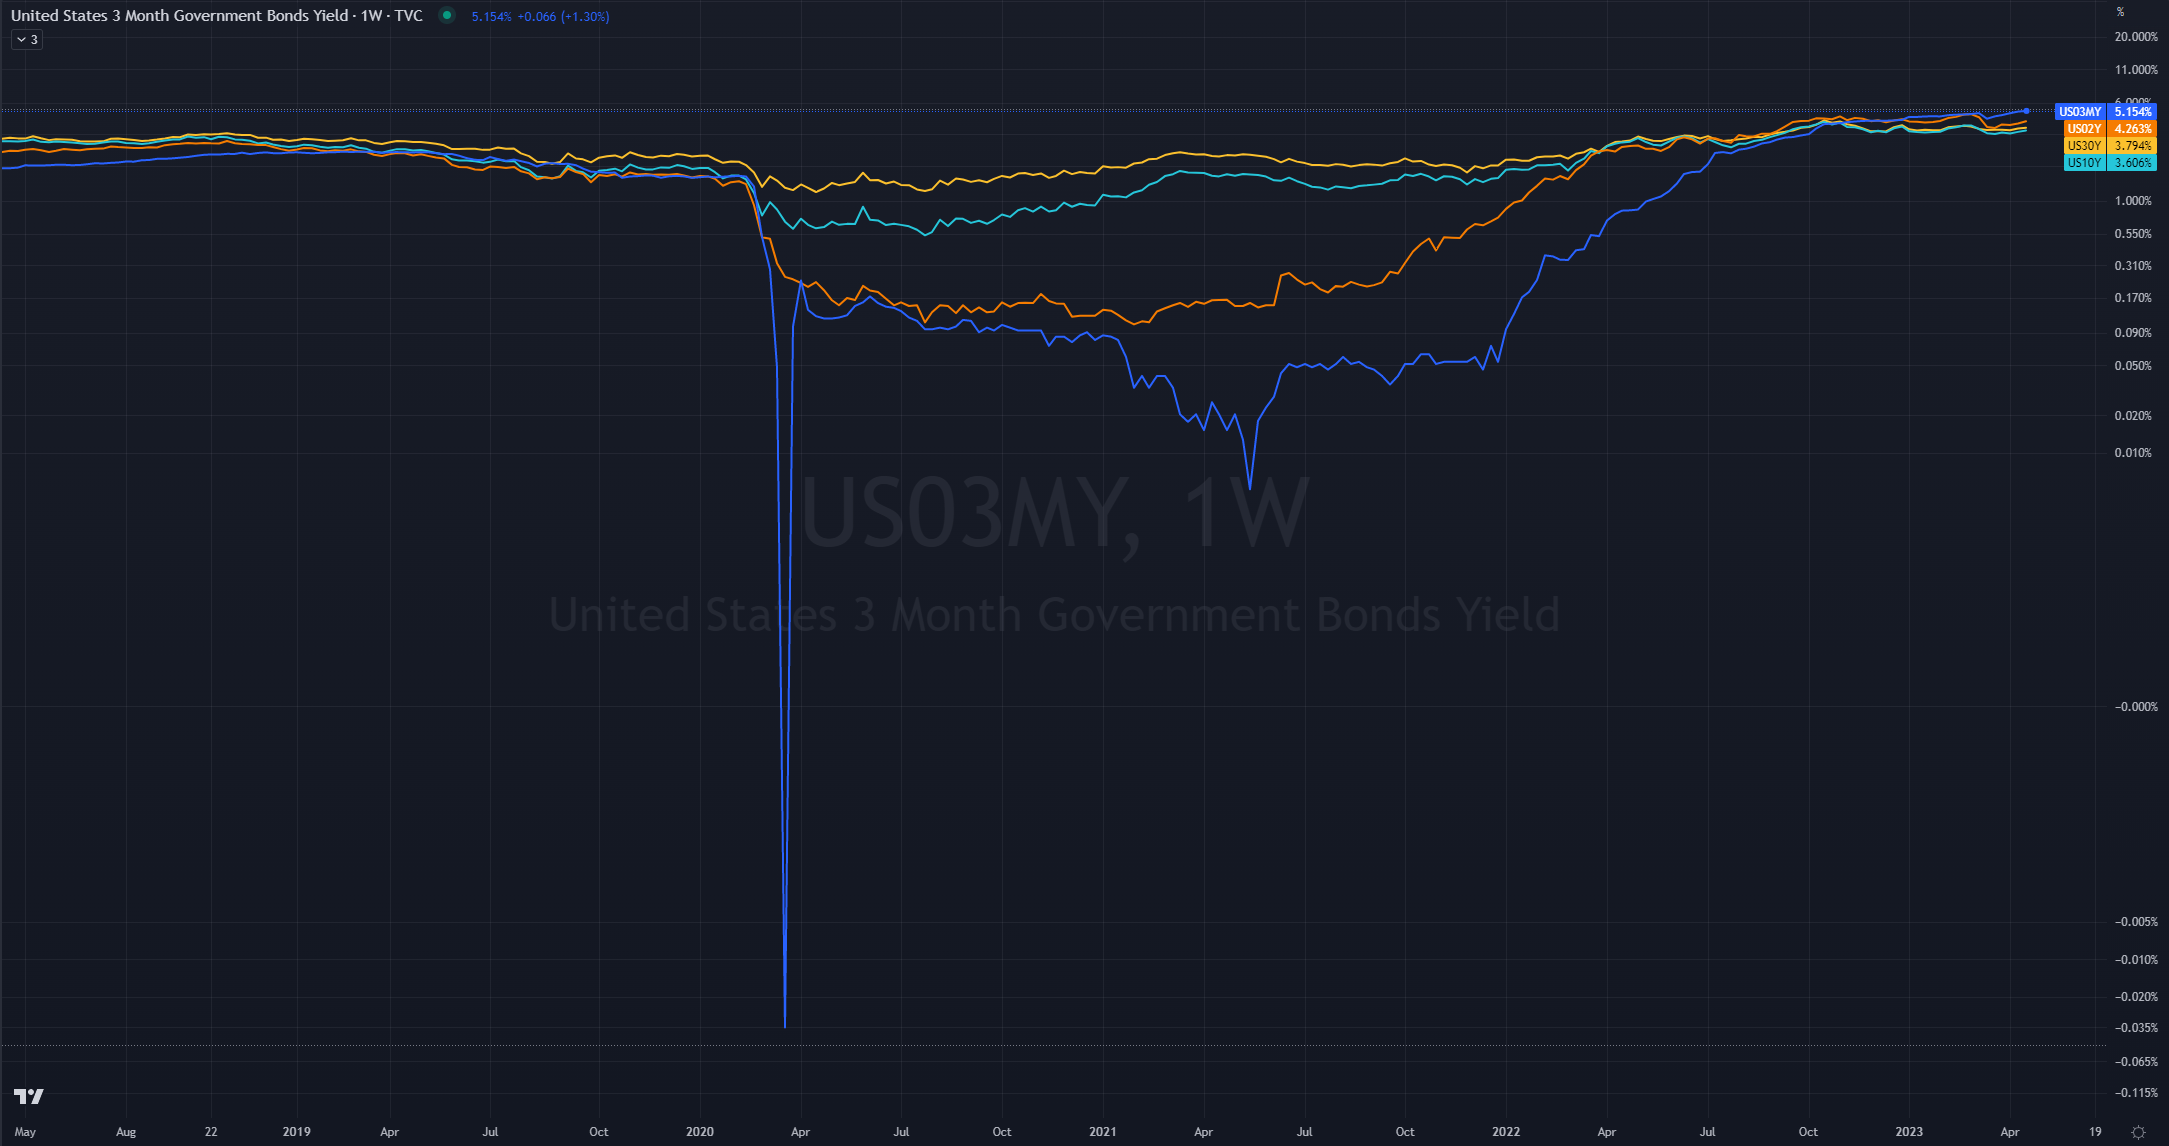
US Treasury yields advanced.
2-year: 🟢 4.25% (+4.9 bps)
📈 Here is the broad market overview as of the current day’s close.

S&P 500 Breakdown
📈 Here is a breakdown of the S&P 500 by sector, style and top holdings.

E-mini S&P 500 Top-Down Analysis
📈 Below are the monthly, weekly, daily and 4-hour charts for $ES_F.
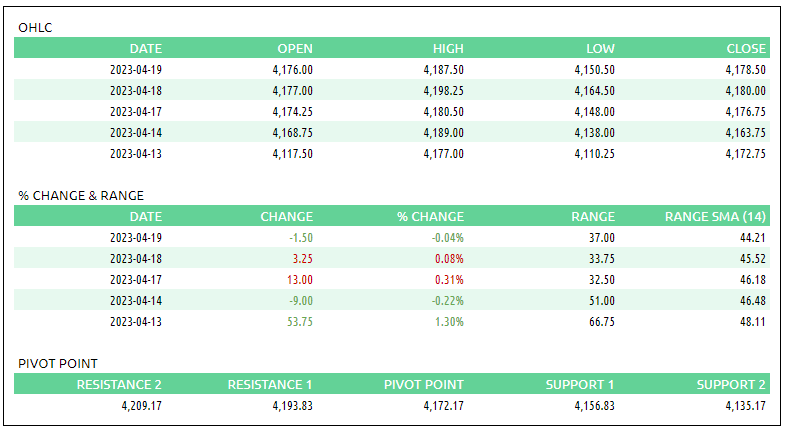
Monthly: 🟡 Balance / consolidation. [Last 4-months: 3788.50 - 4208.50]
Weekly: 🟢 One time framing up / higher lows. [Nearest low: 4098.75]
Daily: 🟡 Balance / consolidation. [Last 3-days: 4148 - 4198.25]
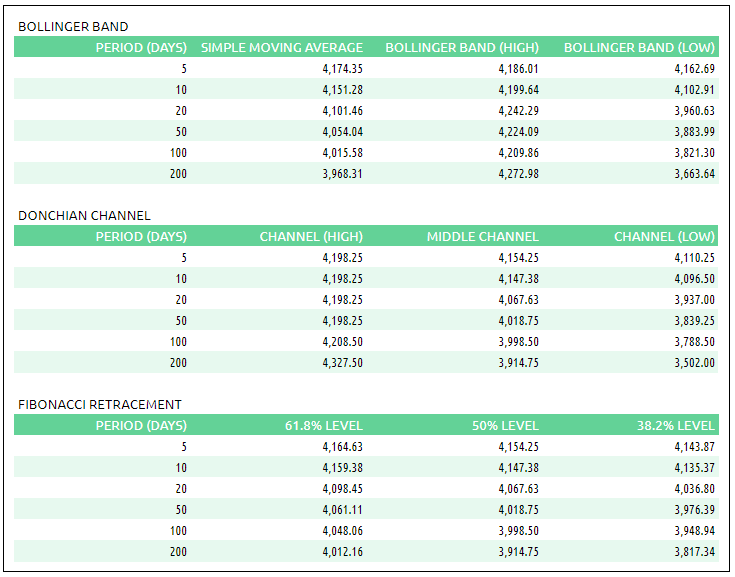
E-mini S&P 500 Metrics
Recent Performance & Technicals
E-mini S&P 500 Volume/Market Profile
ES Composite Volume Profile
📈 Here is a chart of the past few sessions with a 5-day composite ETH Volume Profile:

ES ETH/RTH Split Volume Profile
📈 Here is a chart of the past few sessions with a daily ETH/RTH split Volume Profile:

ES Market/Volume Profile Levels

Session Recap
Electronic Trading Hours (ETH)
Overnight Session:
Wholesale was long at the prior day’s close. The overnight open was inside the prior day’s value area. There was no demand overnight as $ES_F couldn’t trade above 4178.50 during the Asian and London sessions. The auction trended down the entire session, eventually falling below the prior day’s low and reaching two standard deviations under the weekly-anchored VWAP. Wholesale inventory was short and in search of buyers. At 4150.50, a new session low and two standard deviations below the weekly-anchored VWAP, supply was absorbed and responsive buyers lifted the offer going into RTH. Overnight VPOC was 4157.75.
Regular Trading Hours (RTH) Session:
The RTH open gapped down and was below the prior day’s range but inside the T+2 range. There was little supply when the NY session opened as price fell by only 3-ticks before buyers swiftly absorbed supply. After supply was cleaned out near the current session’s VWAP, price action easily reached the 1st standard deviation above by the end of the B-period. The auction continued to trend upward between the first and second standard deviations, eventually getting over the weekly-anchored VWAP and overnight high. At 4187.50, near the 2nd standard deviation above the weekly-anchored VWAP and the bottom of the previous day’s A-period high volume node, buyers were consumed by supply. After this absorption in J-period, there was strong rejection which led to trapped long traders. Selling pressure then forced the market lower for the remainder of the session. There was a bid at 4172.50 which sellers couldn’t take out in M and N-period, that enabled the auction to close above the weekly and daily VWAP.