
04/18/2023 Synopsis
Earnings and housing starts data leaves equities mixed.

Market Overview

The S&P 500 was up in today’s session. 7/11 sectors were positive.
Outperforming Index: 🟢 S&P 500 SPY 0.00%↑
Underperforming Index: 🔴 Russell 2000 IWM 0.00%↑
Strongest Sector: 🟢 Industrials XLI 0.00%↑
Weakest Sector: 🔴 Health care XLV 0.00%↑
Top Stock: 🟢 Tyler Technologies TYL 0.00%↑
Poorest Stock: 🔴 Catalent Inc CTLT 0.00%↑
US Treasury yields were mixed.
2-year: 🟢 4.20% (+0.3 bps)

📈 Here is the broad market overview as of the current day’s close.

S&P 500 Breakdown
📈 Here is a breakdown of the S&P 500 by sector, style and top holdings.

E-mini S&P 500 Top-Down Analysis
📈 Below are the monthly, weekly, daily and 4-hour charts for $ES_F.
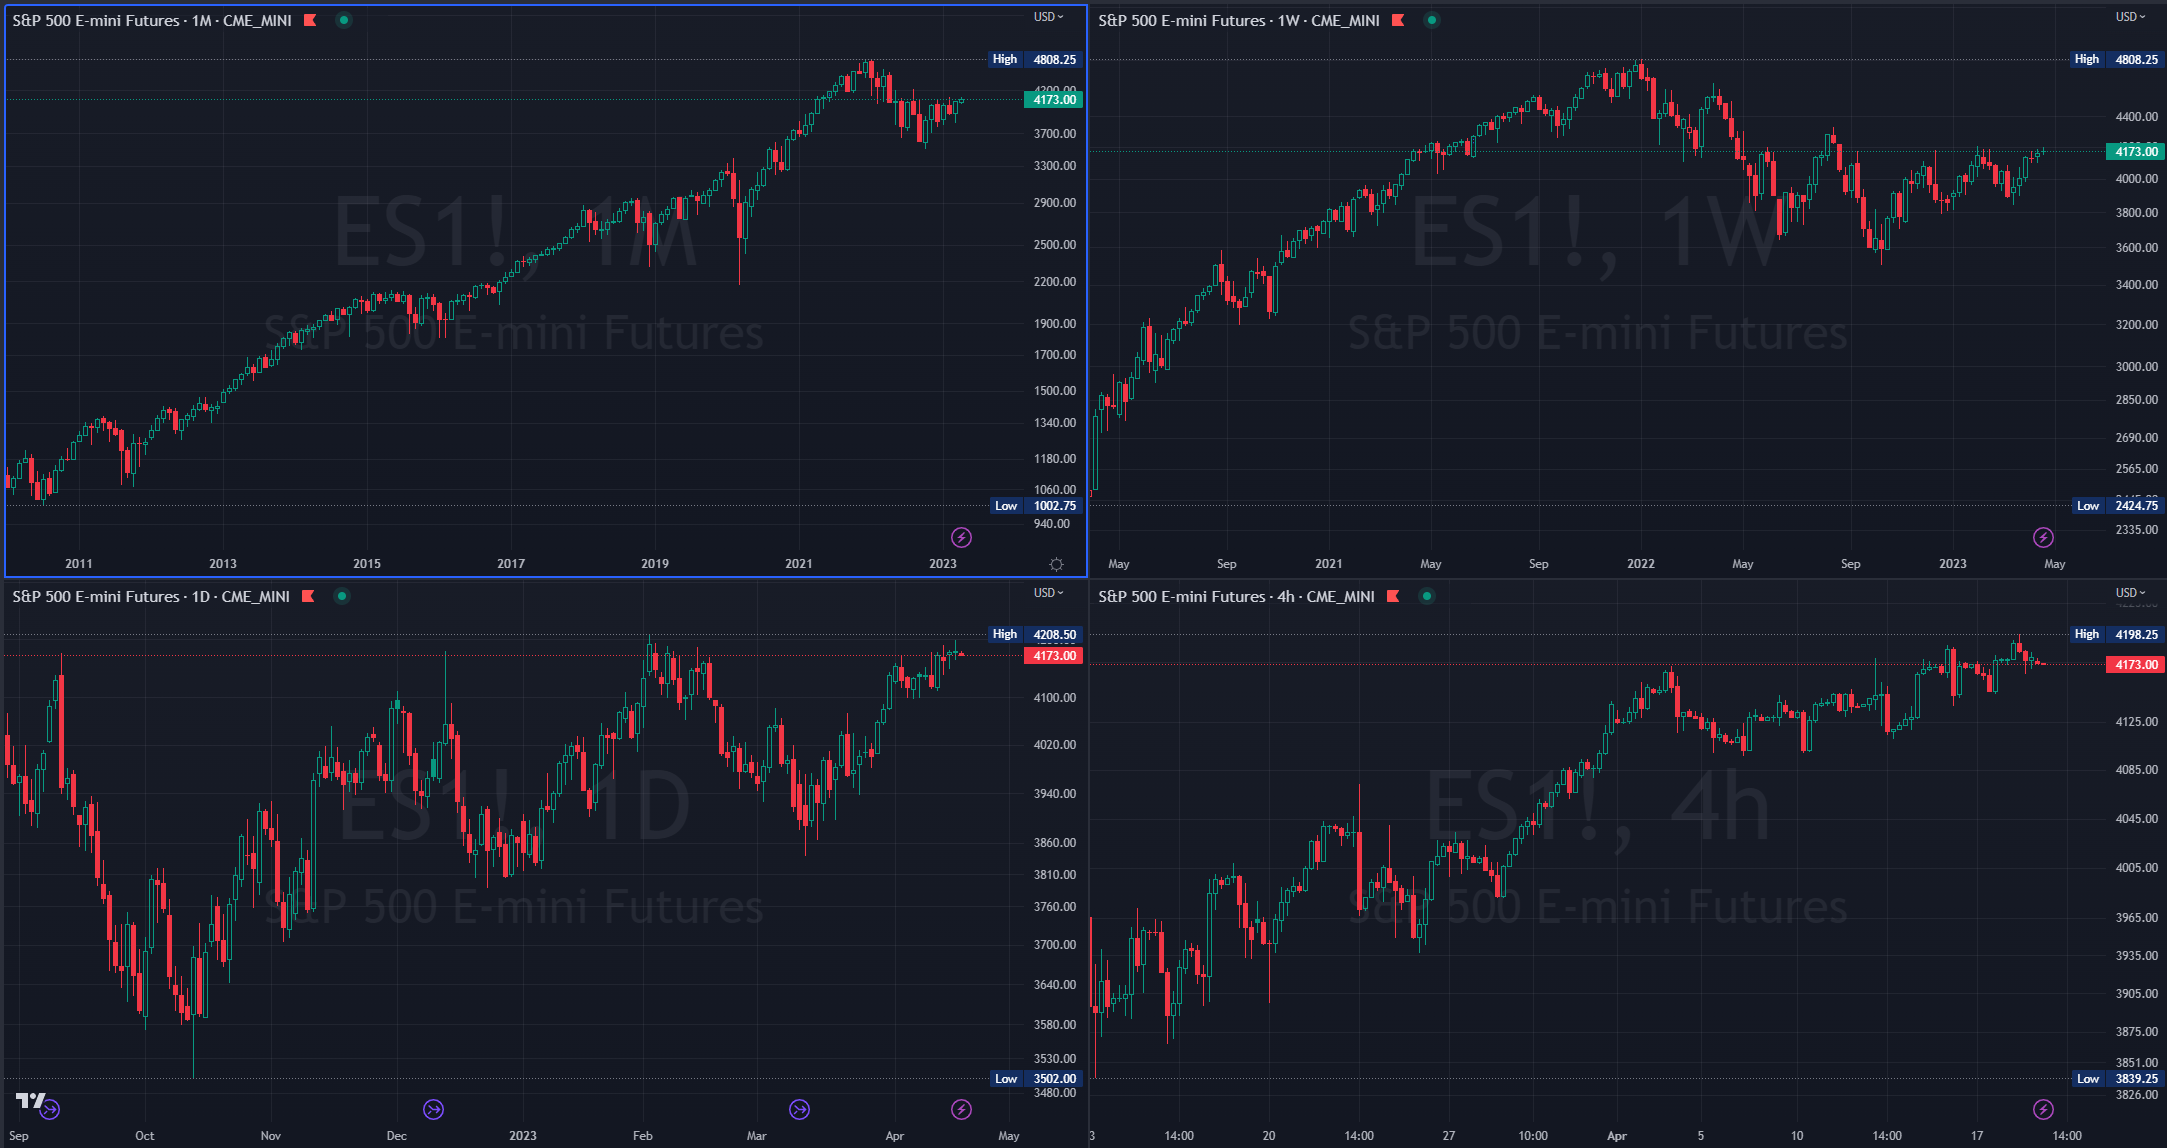
Monthly: 🟡 Balance / consolidation. [Last 4-months: 3788.50 - 4208.50]
Weekly: 🟢 One time framing up / higher lows. [Nearest low: 4098.75]
Daily: 🟢 One time framing up / higher lows. [Nearest low: 4164.50]
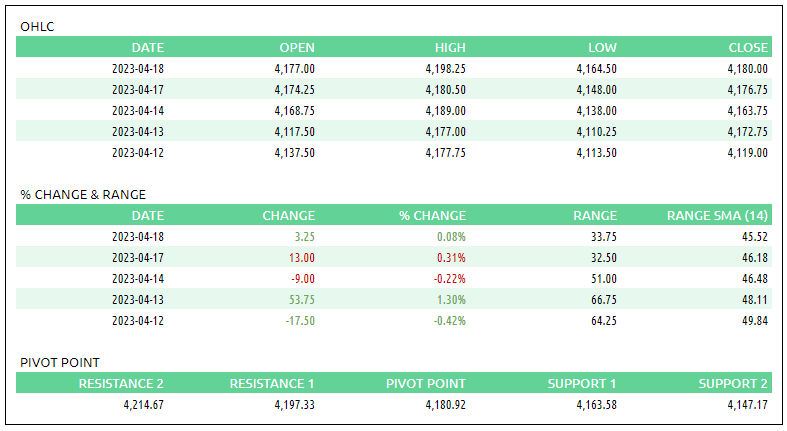
E-mini S&P 500 Metrics
Recent Performance & Technicals

E-mini S&P 500 Volume/Market Profile
ES Composite Volume Profile
📈 Here is a chart of the past few sessions with a 5-day composite ETH Volume Profile:
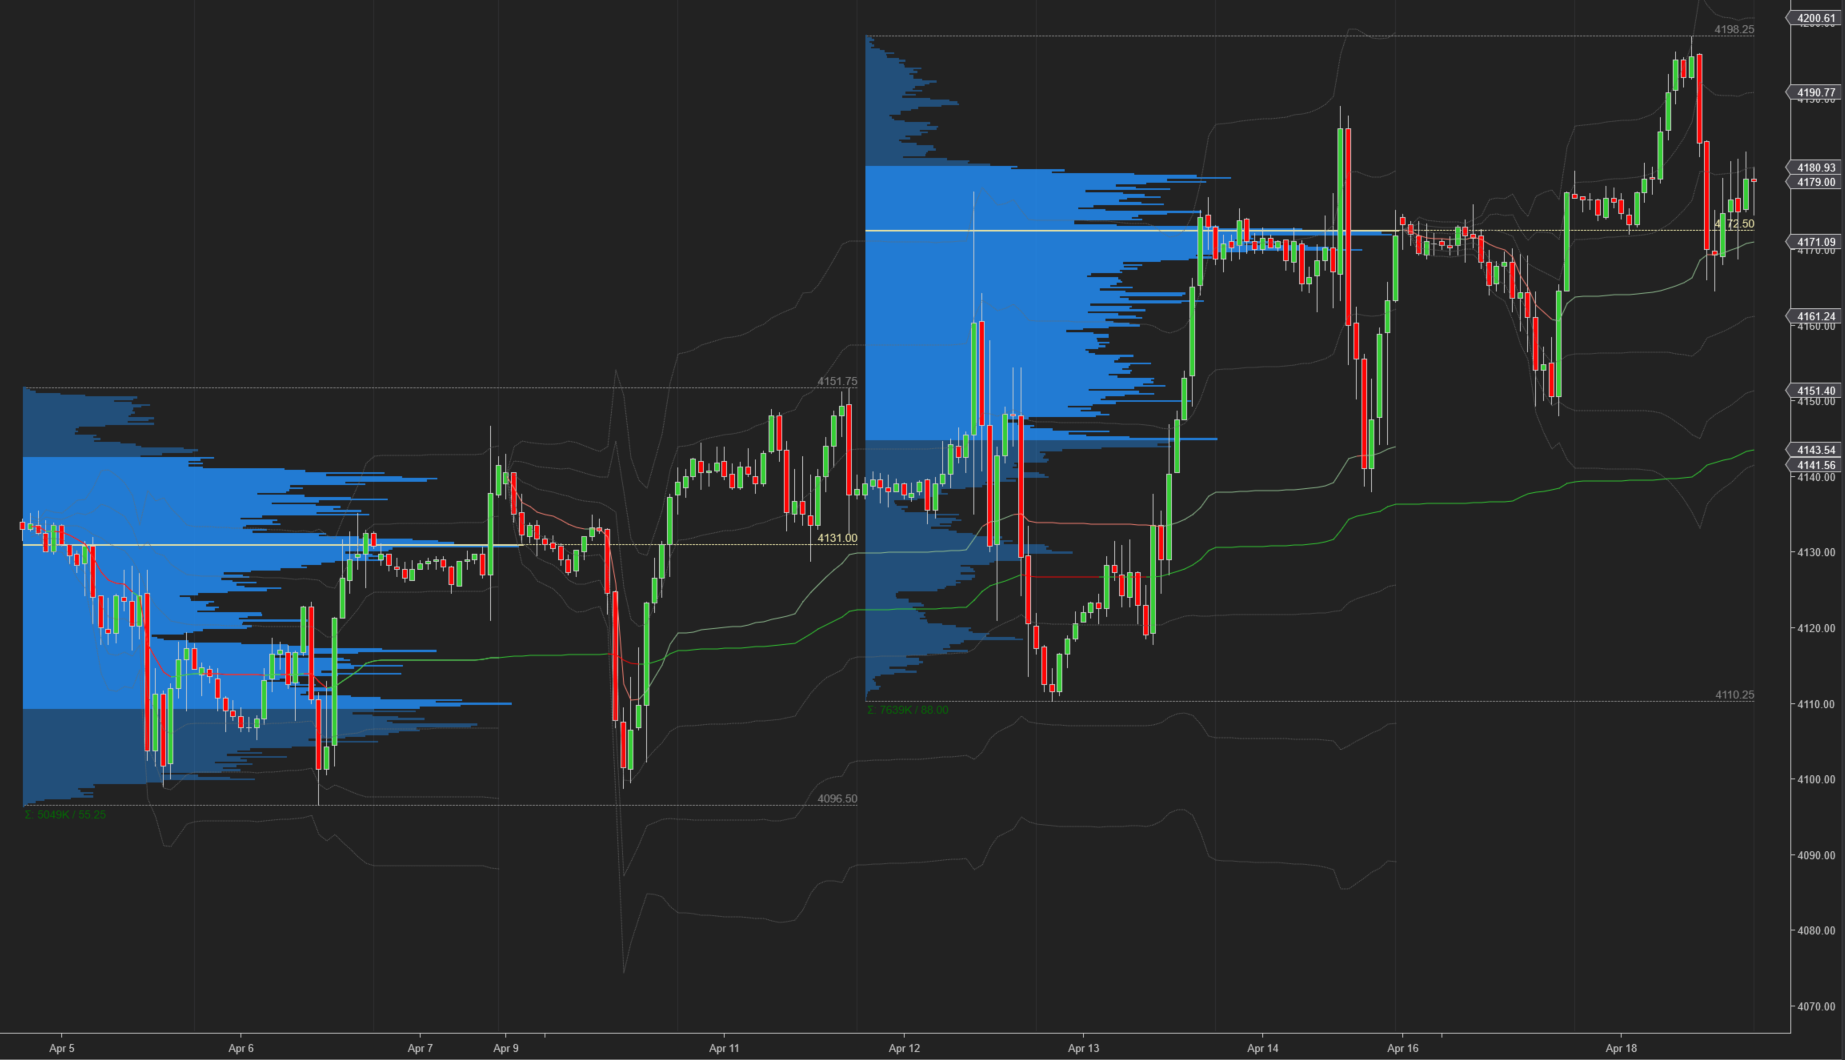
ES ETH/RTH Split Volume Profile
📈 Here is a chart of the past few sessions with a daily ETH/RTH split Volume Profile:

ES Market/Volume Profile Levels

Session Recap
Electronic Trading Hours (ETH)
Overnight Session:
Wholesale inventory was long at the prior day’s close. The overnight open was above the prior day’s value area. Price action was flat during the Asian session with a limited amount of supply being consumed by trapped shorts at 4172. $ES_F rotated up as they lifted the offer and continued to do so when the London session opened. The auction took out the prior day’s high and reached two standard deviations above VWAP. At 4198.25, there was supply from trapped long inventory that absorbed buyers and stalled the uptrend. Wholesale inventory during the overnight session was long above the prior day’s close with overnight VPOC at 4194.
Regular Trading Hours (RTH) Session:
The RTH open gapped up above the prior day and T+2 highs. Once NY trading began, the auction could only rise a few ticks above the open, unable to take out the overnight high. This was an early indicator that supply was present. As wholesale searched for demand, their inventory was marked down. The overnight gap and the prior day’s M-period single prints were both filled as $ES_F lost 30-points in the first 3 TPO periods. A VPOC began to form at 4170, near the weekly-anchored VWAP, as the market traded sideways from periods C through E. A short covering bounce occurred after the auction drifted down to 4164.50, underneath the weekly-anchored VWAP, as passive buyers absorbed supply. $ES_F climbed and retested the Globex-anchored VWAP multiple times as it traded sideways in a range for the next 9 TPO periods. The VPOC slowly crept up as it repeatedly failed to regain and close above the prior day’s high and the B-period high. The auction settled several ticks above VWAP and remained flat during the N and O periods.