
04/17/2023 Synopsis
Homebuilder Confidence Boosts Stocks

Market Overview
The S&P 500 was up in today’s session. 8/11 sectors were positive.
Outperforming Index: 🟢 Russell 2000 IWM 0.00%↑
Underperforming Index: 🔴 Nasdaq-100 QQQ 0.00%↑
Strongest Sector: 🟢 Real estate XLRE 0.00%↑
Weakest Sector: 🔴 Energy XLE 0.00%↑
Top Stock: 🟢 M&T Bank Corporation MTB 0.00%↑
Poorest Stock: 🔴 State Street Corporation STT 0.00%↑
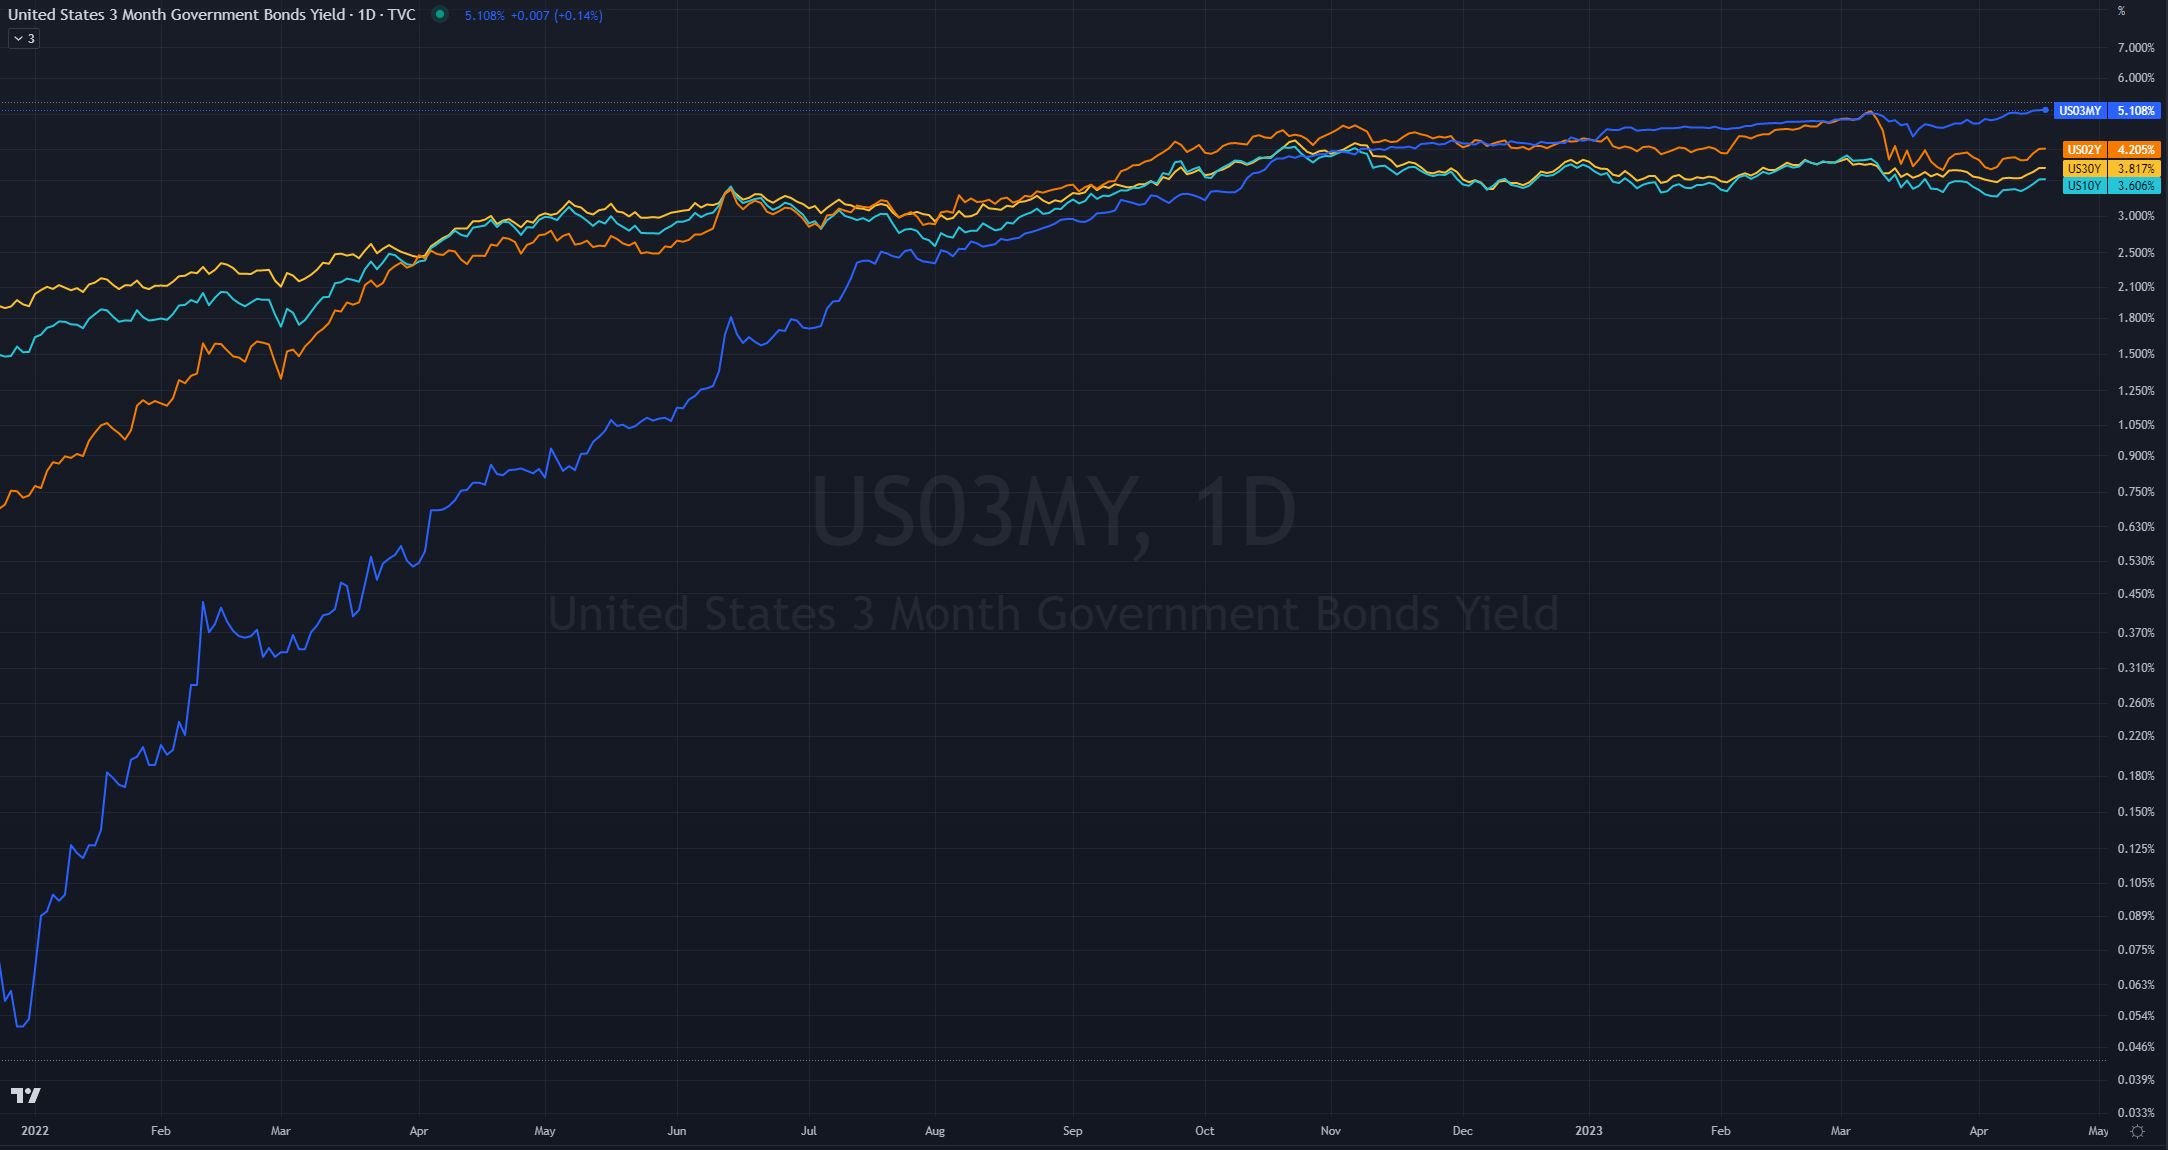
US Treasury yields advanced.
2-year: 🟢 4.19% (+9.5 bps)
📈 Here is the broad market overview as of the current day’s close.

S&P 500 Breakdown
📈 Here is a breakdown of the S&P 500 by sector, style and top holdings.

E-mini S&P 500 Top-Down Analysis
📈 Below are the monthly, weekly, daily and 4-hour charts for $ES_F.

Monthly: 🟡 Balance / consolidation. [Last 4-months: 3788.50 - 4208.50]
Weekly: 🟢 One time framing up / higher lows. [Nearest low: 4098.75]
Daily: 🟢 One time framing up / higher lows. [Nearest low: 4148]
E-mini S&P 500 Metrics
Recent Performance & Technicals


E-mini S&P 500 Volume/Market Profile
ES Composite Volume Profile
📈 Here is a chart of the past few sessions with a 5-day composite ETH Volume Profile:

ES ETH/RTH Split Volume Profile
📈 Here is a chart of the past few sessions with a daily ETH/RTH split Volume Profile:
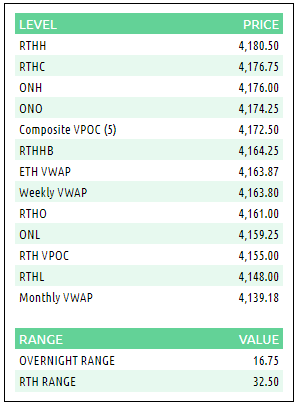
ES Market/Volume Profile Levels
Session Recap
Electronic Trading Hours (ETH)
Overnight Session:
Wholesale was inventory was long at the prior day’s close, having got there on a late push up during N and O-period. Shorts investors were trapped on late covering rally. The overnight open was inside of the prior day’s range but above the value area. Trapped supply kept the auction from rising above 4176. Inventory during the overnight session was rangebound in a 15-point channel. As RTH approached, traders were trapped long and wholesale was searching for demand. Overnight VPOC was 4172.
Regular Trading Hours (RTH) Session:
The RTH open traded inside the prior day's value area and within the T+2 range without a gap. The market initially moved sideways within a descending 10 to 15-point balance zone for the first four TPO-periods of RTH, creating lower highs and dipping below the overnight range. In E-period, sellers broke through the passive bid at 4156.50 and continued driving prices lower. The market traded sideways for the next five TPO-periods within a 10-point range until J-period, where supply was completely absorbed by the bid at 4148, leading to a strong short covering rally. $ES_F erased the overnight high and reached two standard deviations above VWAP, leaving behind an area of single prints during M-period. Buyers continued lifting the auction after the NYSE close, reaching a new session high of 4180.50 before backfilling during O-period. Today’s price action stayed inside the prior day's range, creating an inside day.