
04/14/2023 Synopsis
Fed Governor's hawkish comments put pressure on equities. Financials flew as JPMorgan beat on top and bottom lines.

Market Overview

The S&P 500 was down in today’s session. 3/11 sectors were positive.
Outperforming Index: 🟢 S&P 500 SPY 0.00%↑
Underperforming Index: 🔴 Russell 2000 IWM 0.00%↑
Strongest Sector: 🟢 Financials XLF 0.00%↑
Weakest Sector: 🔴 Real estate XLRE 0.00%↑
Top Stock: 🟢 JPMorgan Chase JPM 0.00%↑
Poorest Stock: 🔴 Catalent, Inc CTLT 0.00%↑
US Treasury yields advanced.
2-year: 🟢 4.10% (+13.1 bps)

Events this week:

📈 Here is the broad market overview as of the current day’s close.

S&P 500 Breakdown
📈 Here is a breakdown of the S&P 500 by sector, style and top holdings.

E-mini S&P 500 Top-Down Analysis
📈 Below are the monthly, weekly, daily and 4-hour charts for $ES_F.

Monthly: 🟡 Balance / consolidation. [Last 4-months: 3788.50 - 4208.50]
Weekly: 🟢 One time framing up / higher lows. [Nearest low: 4098.75]
Daily: 🟢 One time framing up / higher lows. [Nearest low: 4138]
E-mini S&P 500 Metrics
Recent Performance & Technicals


E-mini S&P 500 Volume/Market Profile
ES Composite Volume Profile
📈 Here is a chart of the past few sessions with a 5-day composite ETH Volume Profile:

ES ETH/RTH Split Volume Profile
📈 Here is a chart of the past few sessions with a daily ETH/RTH split Volume Profile:
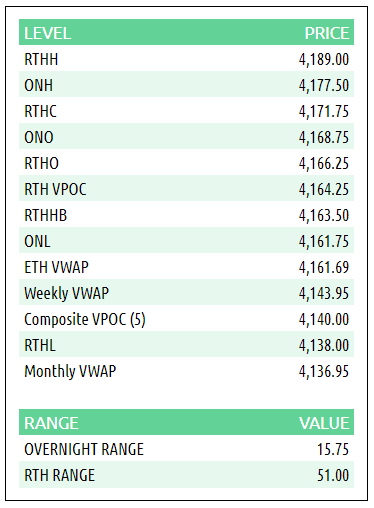
ES Market/Volume Profile Levels
Session Recap
Electronic Trading Hours (ETH)
Overnight Session:
Wholesale inventory was long at the prior day’s close. The overnight open was inside the prior day’s value area. Price action during the Asian and London sessions was bound to a tight range slightly below the prior day’s VPOC. Trapped shorts from the prior day kept the market bid above 4161.75. Wholesale took the auction to 4177.50, 2-ticks above the prior day’s high. However, a lack of follow-through from buyers caused inventory to correct short, where it remained going into RTH. Overnight VPOC was 4170.75.
Regular Trading Hours (RTH) Session:
The RTH open saw $ES_F gap up inside prior day’s value area and above T+2 high. Aggressive buying during A-period drove the market up 20 handles, breaching the overnight and prior day’s highs. $ES_F nearly reached 3 standard deviations above the weekly-anchored VWAP before encountering passive supply at 4189. After sellers took control, the market dropped 50 points over 4-TPO periods before bouncing. Supply broke 3/4 sets of single prints from the prior day. Short covering spurred a 20-point rally after supply shut off at 4138. $ES_F breached 1 standard deviation above the weekly VWAP prior to the ETH close, during N and O-period, to recover some of the losses.