
04/13/2023 Synopsis
March Producer Prices Cool Down, Spurring Rally in Equities

Market Overview
The S&P 500 was up in today’s session. 10/11 sectors were positive.
Outperforming Index: 🟢 Nasdaq-100 QQQ 0.00%↑
Underperforming Index: 🔴 Dow Jones DIA 0.00%↑
Strongest Sector: 🟢 Consumer Discretionary XLY 0.00%↑
Weakest Sector: 🔴 Real estate XLRE 0.00%↑
Top Stock: 🟢 SolarEdge Technologies SEDG 0.00%↑
Poorest Stock: 🔴 The Progressive Corporation PGR 0.00%↑
US Treasury yields advanced.
2-year: 🟢 3.96% (+0.4 bps)

📈 Here is the broad market overview as of the current day’s close.

S&P 500 Breakdown
📈 Here is a breakdown of the S&P 500 by sector, style and top holdings.

E-mini S&P 500 Top-Down Analysis
📈 Below are the monthly, weekly, daily and 4-hour charts for $ES_F.

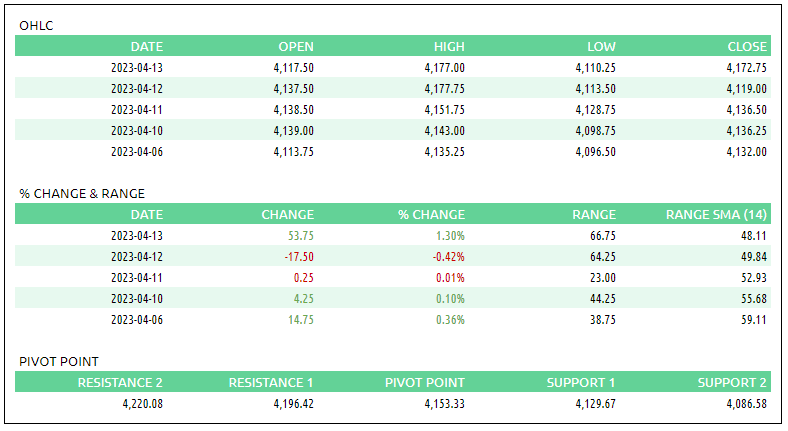
Monthly: 🟡 Balance / consolidation. [Last 4-months: 3788.50 - 4208.50]
Weekly: 🟢 One time framing up / higher lows. [Nearest low: 4096.5]
Daily: 🟡 One time framing up in a larger balance area. [Last 8-days: 4096.50 - 4177.75]
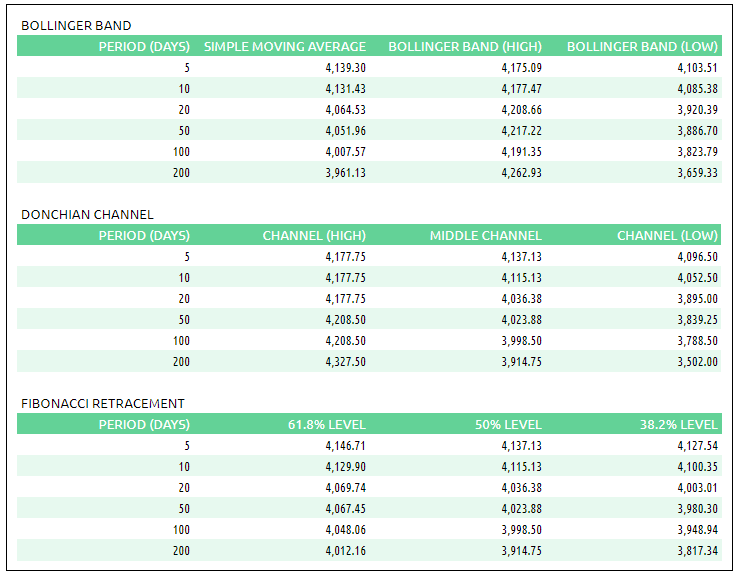
E-mini S&P 500 Metrics
Recent Performance & Technicals
E-mini S&P 500 Volume/Market Profile
ES Composite Volume Profile
📈 Here is a chart of the past few sessions with a 5-day composite ETH Volume Profile:
ES ETH/RTH Split Volume Profile
📈 Here is a chart of the past few sessions with a daily ETH/RTH split Volume Profile:

ES Market/Volume Profile Levels

Session Recap
Electronic Trading Hours (ETH)
Overnight Session:
Wholesale was short at the prior day’s close. The overnight open was below the prior day’s value area. During the Asian open, there wasn’t enough supply to lower the bid at 4110.25. Following the absorption of sellers at this level, buyers stepped in and carried the auction higher. During the London session, responsive sellers prevented $ES_F from accepting inside the previous day’s value area. After going sideways for several TPO-periods, buyers took control and sellers were taken out following the PPI data release. $ES_F got into the previous day’s value area and exceeded 2 standard deviations over VWAP to new session highs. Heading into RTH, inventory was long despite some backfill down to 1 standard deviation. Overnight VPOC was 4129.75.
Regular Trading Hours (RTH) Session:
The RTH open was inside the prior day’s value area and inside the T+2 range. There was no gap between the previous day’s RTH range and the RTH open. $ES_F failed to accept beneath VWAP during A-period, an early sign of insufficient supply easily absorbed by buyers. In B-period, buyers established their control and lifted the auction above the overnight high, a climb of 20-handles off the period low. There was some responsive sellers near 2nd standard deviation above VWAP, which was also near the prior day’s VPOC at 4145. Supply failed to bring $ES_F back down into the overnight range or beneath the +1 standard deviation level before getting completely absorbed. This resulted in another trend upwards as $ES_F rode the +2 standard deviation level for several TPO-periods, leaving 3 sets of single prints and trapped shorts on the rise. The uptrend finally hit supply at 4177, 3-ticks short of the reaction spike from the prior day’s post-CPI print. In the N and O-period after the NYSE close, there was plenty of selling, 23k contracts liquidated, which buyers were able to absorb on the bid as price barely moved any lower. $ES_F began the day underneath the minus 1 standard deviation level on the weekly-anchored VWAP and ended the day more than 2 standard deviations above the weekly-anchored VWAP.