
04/12/2023 Synopsis
Stocks tumble despite softer-than-expected CPI as Fed Meeting Minutes expose recession concerns over recent banking woes.

Market Overview

The S&P 500 was down in today’s session. 4/11 sectors were positive.
Outperforming Index: 🟢 Dow Jones DIA 0.00%↑
Underperforming Index: 🔴 Nasdaq-100 QQQ 0.00%↑
Strongest Sector: 🟢 Industrials XLI 0.00%↑
Weakest Sector: 🔴 Consumer Discretionary XLY 0.00%↑
Top Stock: 🟢 Bio-Techne Corporation TECH 0.00%↑
Poorest Stock: 🔴 DISH Network Corporation DISH 0.00%↑
US Treasury yields retreated.
2-year: 🔴 3.96% (-6.1 bps)

📈 Here is the broad market overview as of the current day’s close.

S&P 500 Breakdown
📈 Here is a breakdown of the S&P 500 by sector, style and top holdings.

E-mini S&P 500 Top-Down Analysis
📈 Below are the monthly, weekly, daily and 4-hour charts for $ES_F.
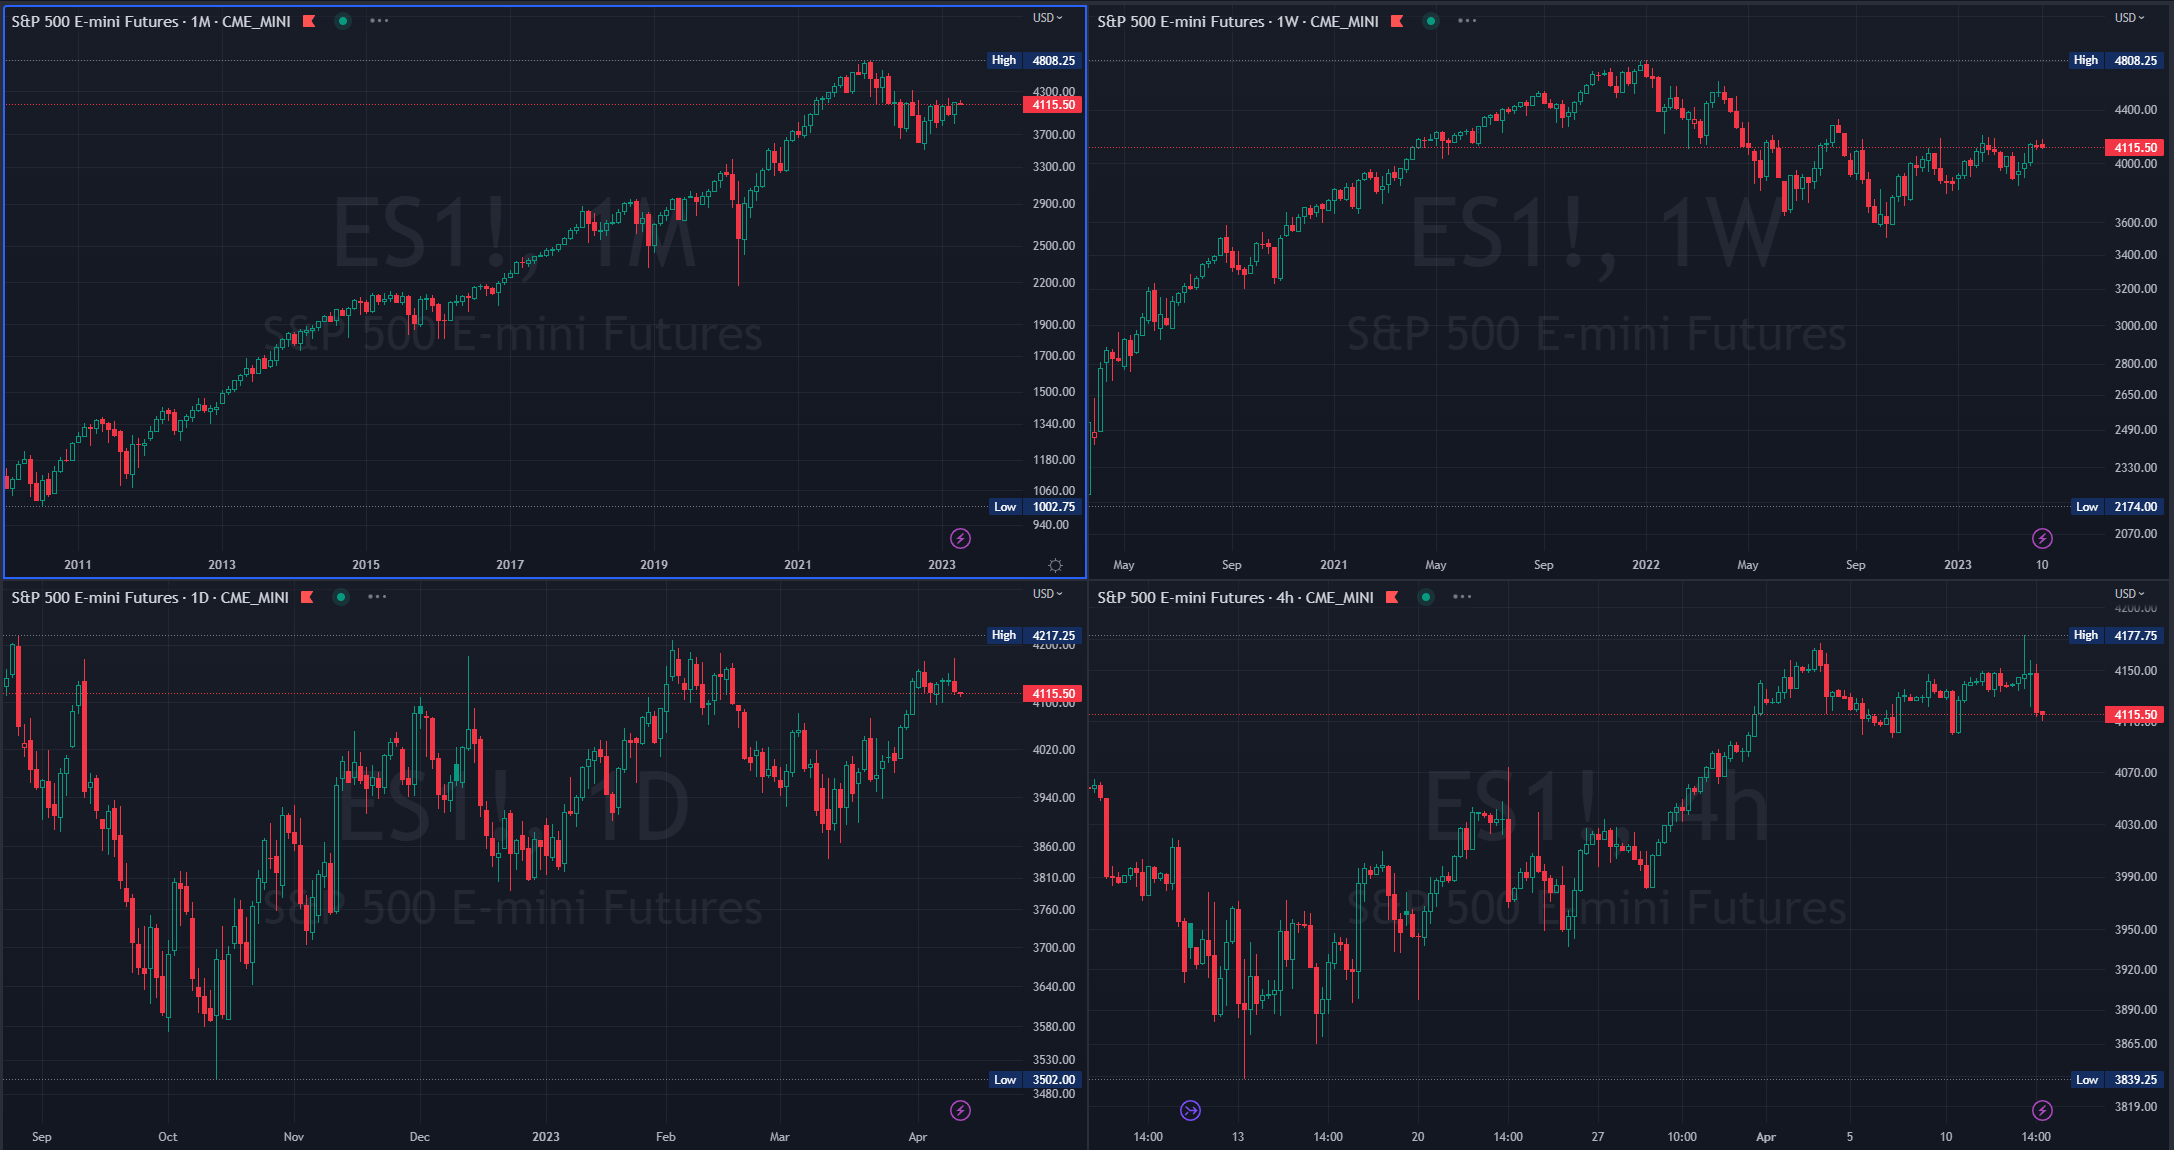
Monthly: 🟡 Balance / consolidation. [Last 4-months: 3788.50 - 4208.50]
Weekly: 🟢 One time framing up / higher lows. [Nearest low: 4096.5]
Daily: 🟡 Outside down day in a larger balance area. [Last 7-days: 4096.50 - 4177.75]
E-mini S&P 500 Metrics
Recent Performance & Technicals


E-mini S&P 500 Volume/Market Profile
ES Composite Volume Profile
📈 Here is a chart of the past few sessions with a 5-day composite ETH Volume Profile:

ES ETH/RTH Split Volume Profile
📈 Here is a chart of the past few sessions with a daily ETH/RTH split Volume Profile:

ES Market/Volume Profile Levels

Session Recap
Electronic Trading Hours (ETH)
Overnight Session:
Wholesale closed flat the prior day, and the overnight open occurred within the previous day’s value area. Long traders were on the wrong side of the market during the M-period liquidation, and a trapped short position remained below the previous day's close. During the Asian and London sessions, trading was rangebound as investors awaited the release of CPI data. Following a cooler than expected CPI print, $ES_F soared to 4177.75, marking a 40-day high and falling just below the 23.6% Fibonacci level, 4186.50, from March 2020's low to January 2022's high. However, Wholesale backfilled nearly 20 points, while inventory going into RTH remained long. The overnight session's VPOC was recorded at 4138.75.
Regular Trading Hours (RTH) Session:
The RTH open saw $ES_F gap up above the prior day’s price range and above the T+2 high. The opening hour was volatile, and the auction traded back and forth in a 20-point range which filled the overnight gap. In C-period, the price failed to accept over the plus 1 standard deviation over the weekly anchored-VWAP, leading to supply liquidation and the auction falling 35 to 40-handles. This move took the market below the overnight low and prior day’s low, down to the G-period single prints from April 10th. Beyond negative 2 standard deviations is where supply ran out, and shorts covered, resulting in a 30-point bounce. $ES_F failed to trade above 4154.50 for three TPO-periods, leading to another liquidation once the FOMC meeting minutes were released during J-period. The auction made new session lows, taking out the April 10th single prints. However, short covering stabilized the auction at 4113.50, where a weak low was established. $ES_F finished the session a few points higher but closed below the weekly and monthly-anchored VWAPs.