
04/05/2023 Synopsis
The S&P Struggles for Direction as Economic Data Fails to Impress: Closes Negative for 2nd Straight Day

Market Overview
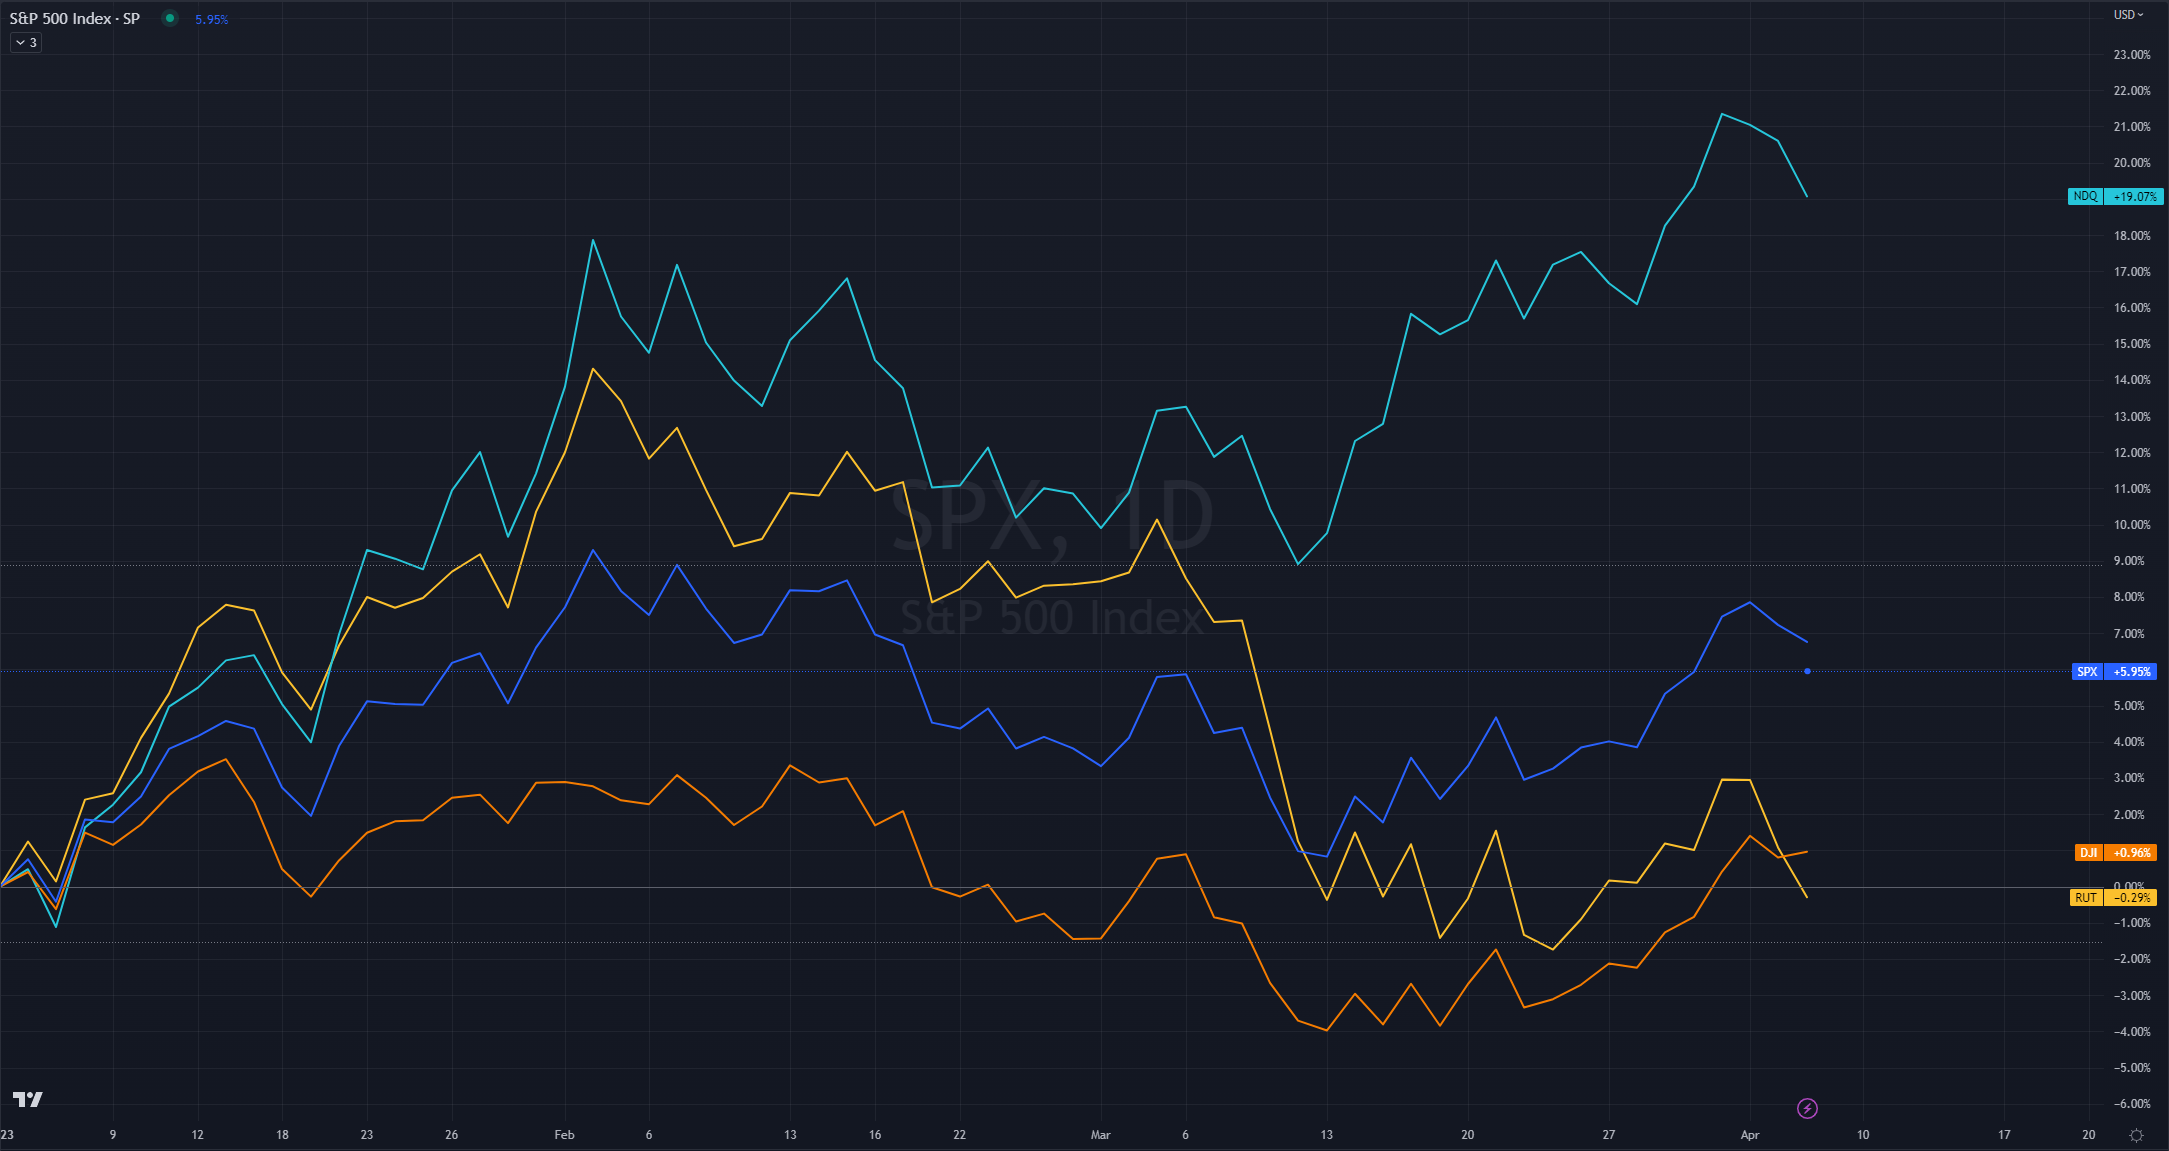
The S&P 500 was down in today’s session. 4/11 sectors were positive.
Outperforming Index: 🟢 Dow Jones DIA 0.00%↑
Underperforming Index: 🔴 Nasdaq-100 QQQ 0.00%↑
Strongest Sector: 🟢 Utilities XLU 0.00%↑
Weakest Sector: 🔴 Consumer discretionary XLY 0.00%↑
Top Stock: 🟢 Phillips 66 PSX 0.00%↑
Poorest Stock: 🔴 MarketAxess Holdings MKTX 0.00%↑
US Treasury yields retreated.
2-year: 🔴 3.79% (-4.1 bps)

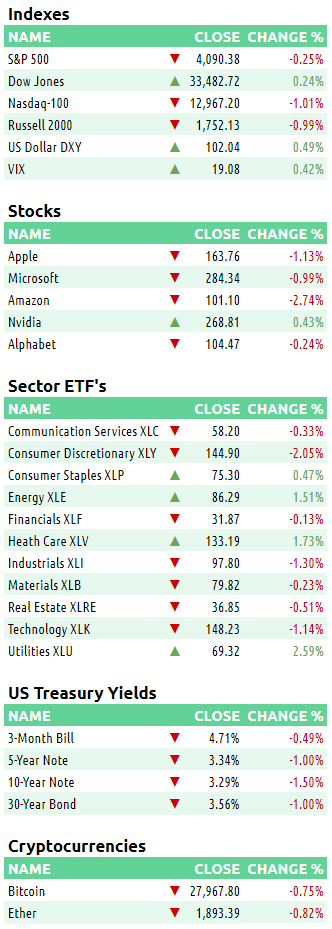
Here are some of today’s closing prices.
E-mini S&P 500 Top-Down Analysis
📈 Below are the monthly, weekly, daily and 4-hour charts for $ES_F.
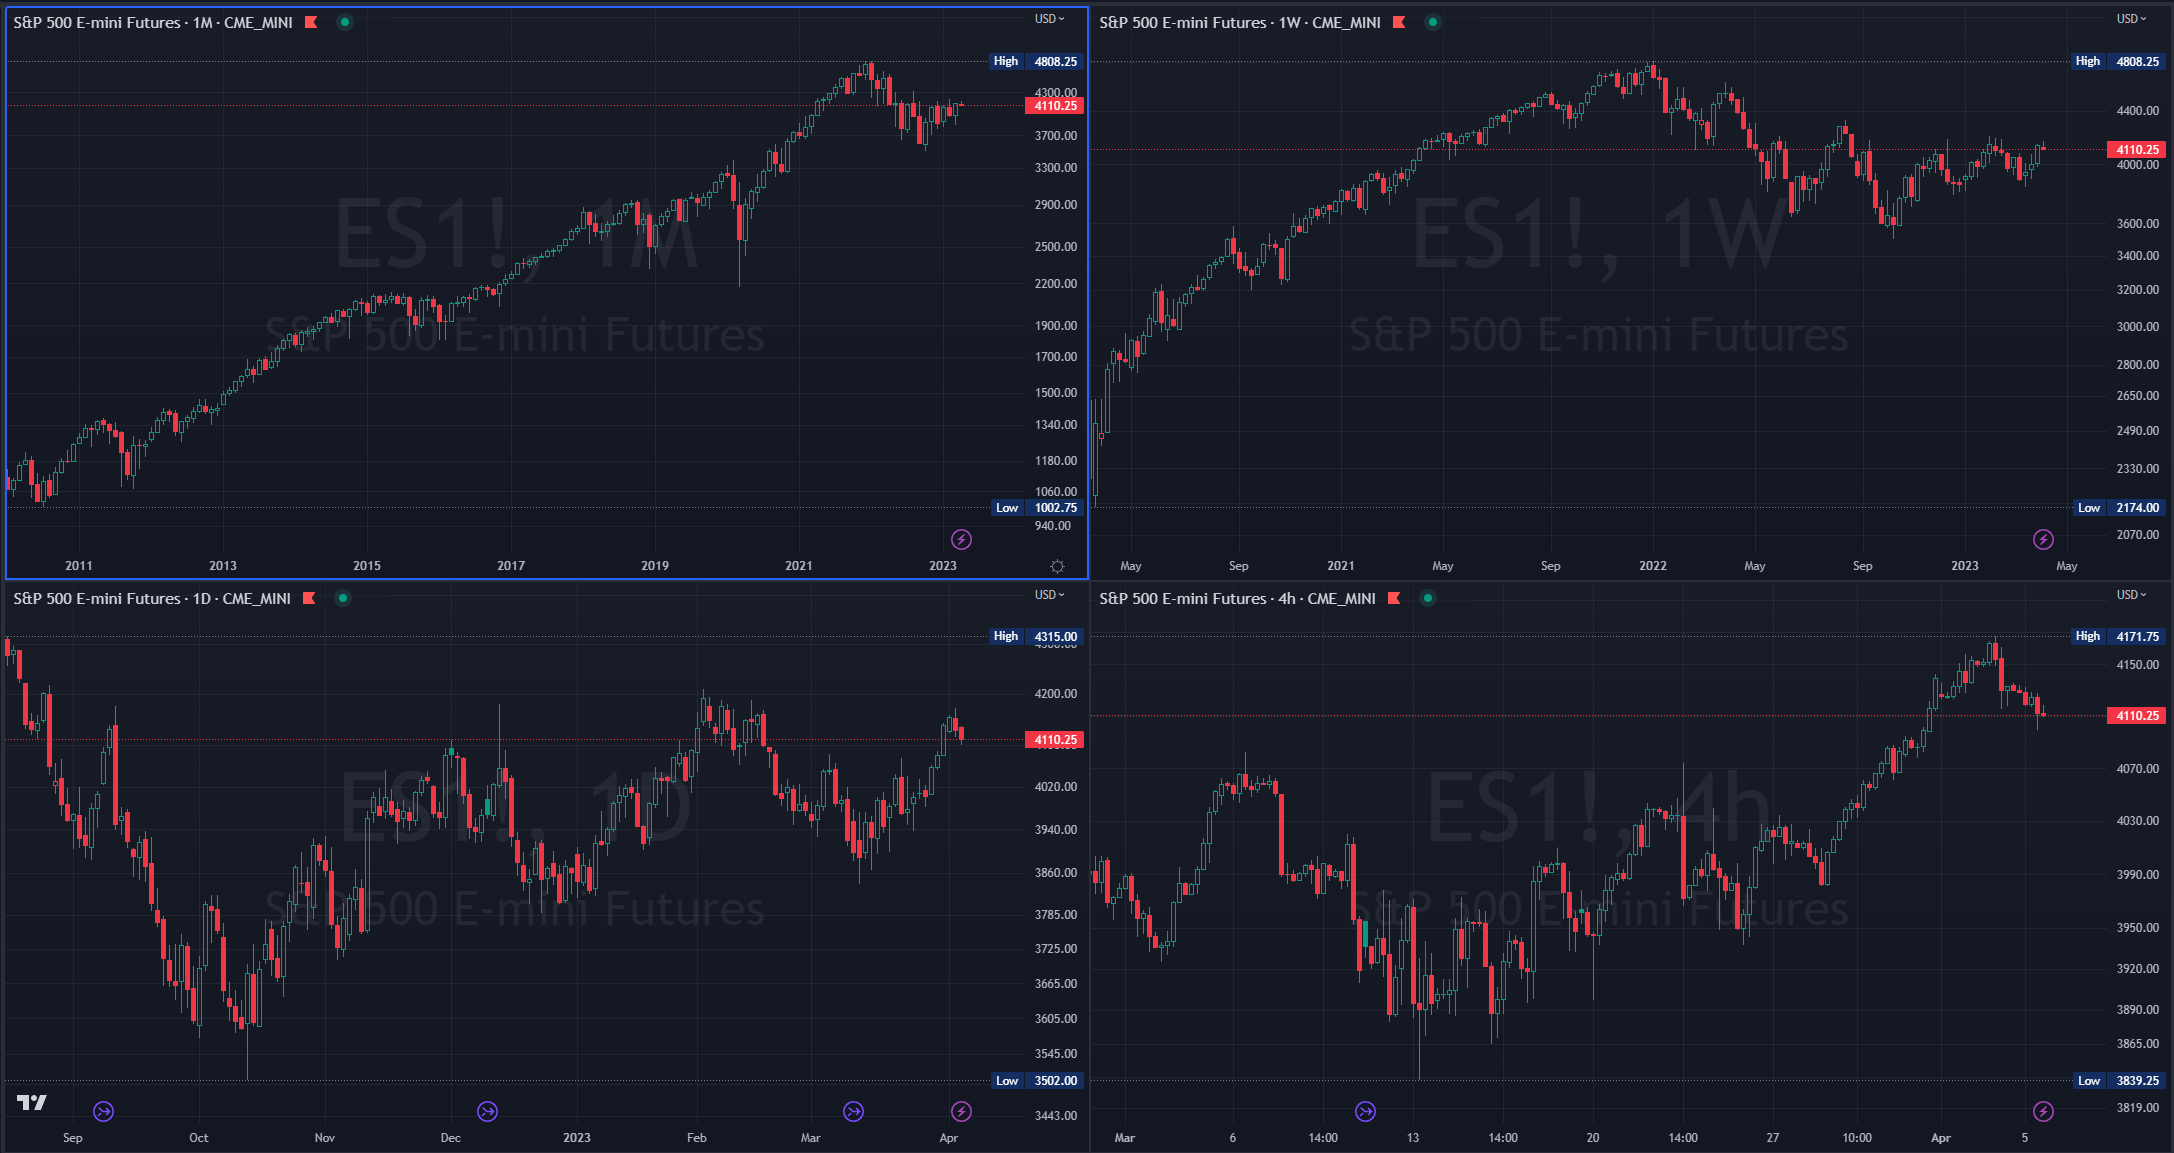
Monthly: 🟡 Balance / consolidation. [Last 4-months: 3788.50 - 4208.50].
Weekly: 🟢 One time framing up / higher lows. [Nearest low: 3980.75]
Daily: 🔴 One time framing down / lower highs. [Nearest high: 4135.50]
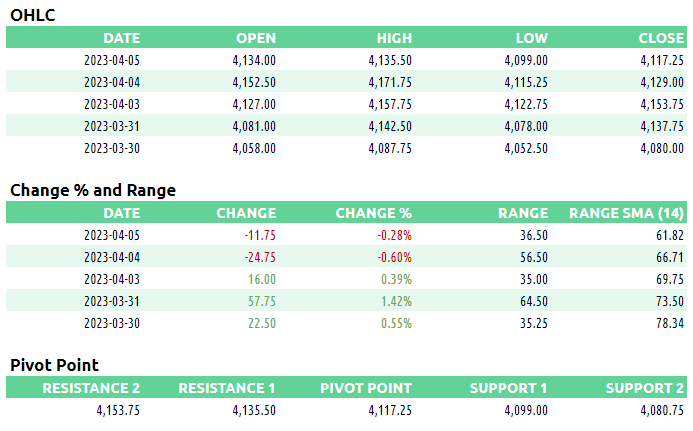
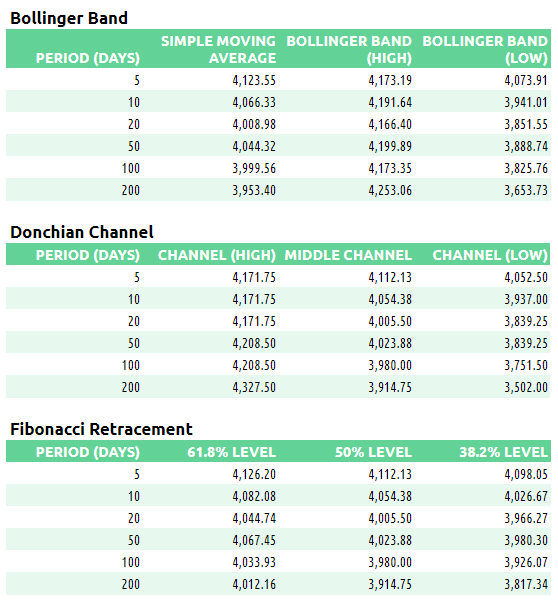
E-mini S&P 500 Metrics
Recent Performance & Technicals
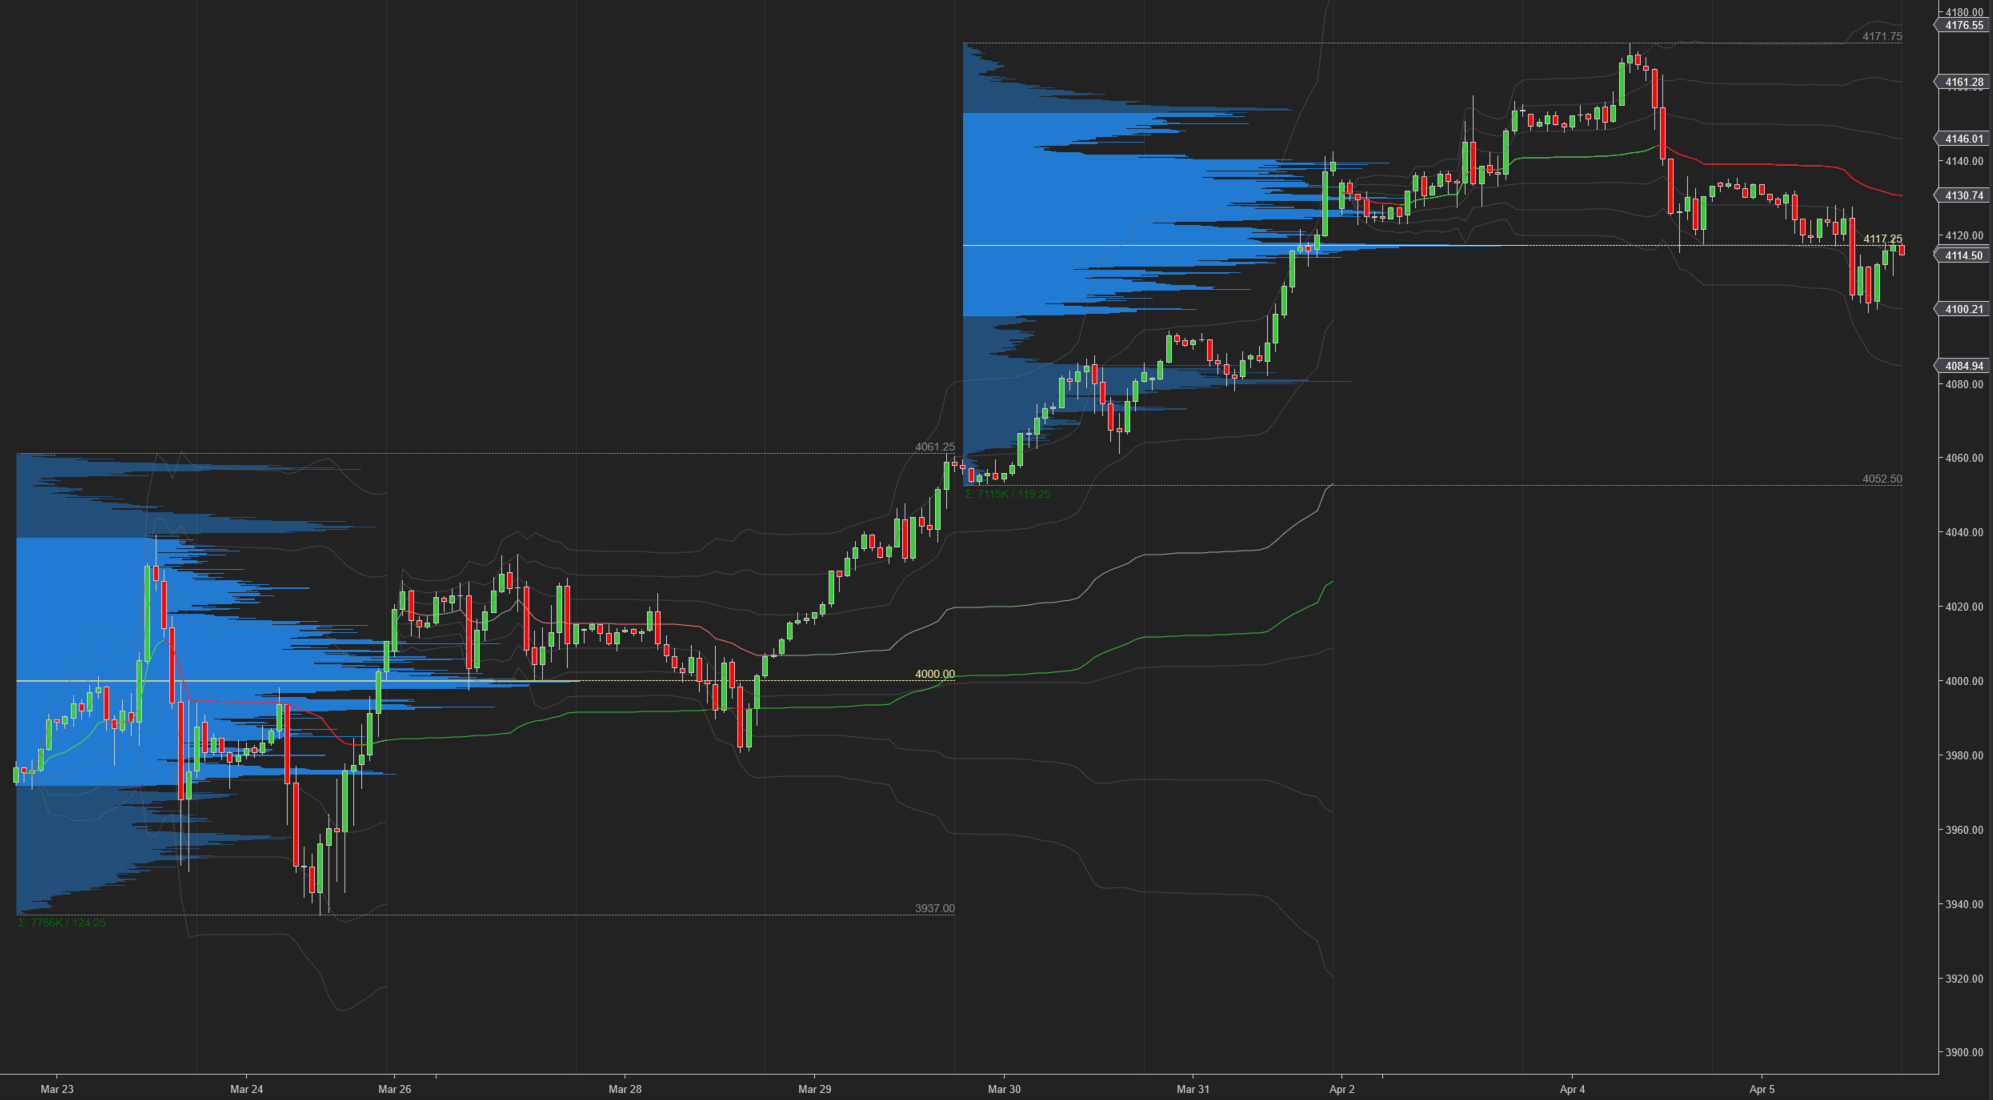
E-mini S&P 500 Volume/Market Profile
ES Composite Volume Profile
📈 Here is a chart of the past few sessions with a 5-day composite ETH Volume Profile:
ES ETH/RTH Split Volume Profile
📈 Here is a chart of the past few sessions with a daily ETH/RTH split Volume Profile:

ES Market/Volume Profile Levels


Session Recap
Electronic Trading Hours (ETH)
Overnight Session:
The market was short at the prior day’s close. The overnight open was inside the prior day’s value area. Inventory during the overnight session was short. During the Asian session, buyers failed to push prices above 4135.50, while trapped longs passively sold and absorbed overnight demand around the lower pair of single prints from the previous day at 4136. As a result, $ES_F continued to trend lower, with wholesale searching for buyers. The auction eventually fell to minus 2 standard deviations beneath VWAP and shorts covered their positions at 4117, just above the prior day's low. The overnight VPOC stood at 4120.
Regular Trading Hours (RTH) Session:
At the RTH open, the market was inside the previous day's value area and below the T+2 low without a gap. The auction briefly went above VWAP during the IB-period, but it quickly turned at 4127.75 and was unable to reach the overnight high or the prior day's close. This suggested the presence of supply, causing $ES_F to slide three standard deviations below VWAP and taking stops at the overnight and prior day's low. Even after some short covering at 4101.75, supply remained present, and $ES_F briefly went below the key psychological level of 4100. However, the bid at 4099 was able to absorb sellers, preventing $ES_F from accepting below 4100. In the next 6-TPO periods, shorts were able to push the auction 20 points higher to get above VWAP. Following the NYSE close, the N and O-periods saw some backfilling, causing $ES_F to end the ETH session just a few ticks below the previous day's low.