04/04/2023 Synopsis
Stocks fell after job openings hit a 2-year low.
Market Overview
The S&P 500 was down in today’s session. 4/11 sectors were positive.
Outperforming Index: 🟢 Nasdaq-100 QQQ 0.00%↑
Underperforming Index: 🔴 Russell 2000 IWM 0.00%↑
Strongest Sector: 🟢 Utilities XLU 0.00%↑
Weakest Sector: 🔴 Industrials XLI 0.00%↑
Top Stock: 🟢 Newmont Corporation NEM 0.00%↑
Poorest Stock: 🔴 Steel Dynamics STLD 0.00%↑
US Treasury yields retreated.
2-year: 🔴 3.83% (-14.1 bps)
Here are some of today’s closing prices.
E-mini S&P 500 Top-Down Analysis
📈 Below are the monthly, weekly, daily and 4-hour charts for $ES_F.
Monthly: 🟡 Balance / consolidation. [Last 4-months: 3788.50 - 4208.50].
Weekly: 🟢 One time framing up / higher lows. [Nearest low: 3980.75]
Daily: 🟡 One time framing up ended with an outside day. Now in a 2-day balance [Last 2-days: 4115.25 - 4171.75]
E-mini S&P 500 Metrics
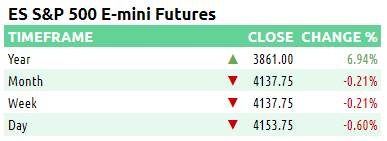
Recent Performance & Technicals
E-mini S&P 500 Volume/Market Profile
ES Composite Volume Profile
📈 Here is a chart of the past few sessions with a composite 5-day ETH Volume Profile:
ES ETH/RTH Split Volume Profile
📈 Here is a chart of the past few sessions with a daily ETH/RTH split Volume Profile:
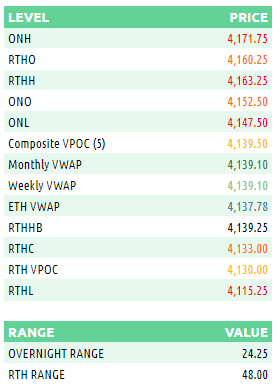
ES Market/Volume Profile Levels
Session Recap
Electronic Trading Hours (ETH)
Overnight Session:
Wholesale was long at the prior day’s close. The overnight open was inside the prior day’s value area. Inventory during the overnight session was long after having been short for 10-hours. The market couldn’t break 4147.50 to the downside, where only 48 contracts were traded on the bid and absorbed by trapped shorts. Wholesale took the market up to the +2 standard deviation level over VWAP once demand came into the market. At 4171.75, 12 contracts were traded on the offer and completely absorbed by trapped long supply. Wholesale backfilled down around VWAP just prior to RTH. Overnight VPOC was 4150.75.
Regular Trading Hours (RTH) Session:
The RTH open was above the prior day’s price range and above the T+2 high. There was a gap up between the previous day’s RTH range and the RTH open. The IB period was choppy. The overnight gap was filled shortly after the NYSE open. At the start of B-period, wholesale took the market right up to 4163.25, the naked VPOC from Feb 16th. There were 70 contracts traded on the offer before trapped sellers began to liquidate. This liquidation resulted in a 50-point drop in which $ES_F fell beneath the overnight low and previous day’s low. Two sets of single prints were left during the slide leaving buyers trapped. $ES_F looked beneath the -2 standard deviation level momentarily but supply couldn’t lower the bid below 4115.25. As shorts covered, the auction stabilized and rotated back and forth in a 20-point range between the -1 and -2 standard deviation levels for the remainder of the session. In M-period, buyers managed to bring $ES_F back into the prior day’s range just before the close.


