
03/17/2023 Synopsis
Escalating banking concerns drove equities and yields lower.

Market Overview

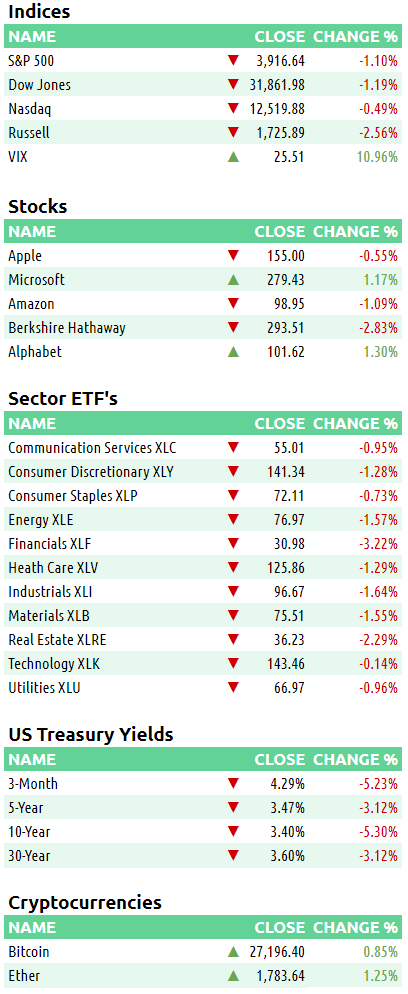
The S&P 500 was down in Friday’s session. 0/11 sectors were positive.
Outperforming Index: 🟢 Nasdaq 100 QQQ 0.00%↑
Underperforming Index: 🔴 Russell 2000 IWM 0.00%↑
Strongest Sector: 🟢 Technology XLK 0.00%↑
Weakest Sector: 🔴 Financials XLF 0.00%↑
Top Stock: 🟢 FedEx Corp FDX 0.00%↑
Poorest Stock: 🔴 First Republic Bank FRC 0.00%↑
The US Dollar index decreased.
$DXY: 🔴 103.86 (-0.55%)
US Treasury yields retreated.
2-year: 🔴 3.84% (-31.5 bps)
10-year: 🔴 3.43% (-14.7 bps)

Events this week:

Here are some of Friday’s closing prices.
E-mini S&P 500 Top-Down Analysis
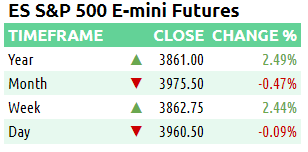
📈 Below are the monthly, weekly, daily and 4-hour charts for $ES_F.
Monthly: Balance / consolidation. [Last 3-months: 3814.5 - 4208.5].
Weekly: Outside down week.
Daily: Balance. [Last 8-days: 3839.25 - 4019.75]
E-mini S&P 500 Metrics
Recent Performance & Technicals


E-mini S&P 500 Volume/Market Profile
ES Composite Volume Profile (5 days)
📈 Here is a chart of the past five sessions with a composite ETH Volume Profile:

ES ETH/RTH Split Volume Profile (5 days)
📈 Here is a chart of the past five sessions with a daily ETH/RTH split Volume Profile:

ES Market/Volume Profile Levels


Session Recap
Electronic Trading Hours (ETH)
Overnight Session:
Wholesale was long at the prior day’s close. The overnight open was inside the prior day’s value area. Inventory during the overnight session was short after being flat for much of it. Shortage of demand couldn’t take out resting offers above 4009.25. Buyers slowly fizzled out and supply pressured the auction lower. Supply ran out at 3956.75, halfway in the top set of single prints from the previous day. Overnight VPOC was 3975.
Regular Trading Hours (RTH) Session:
The RTH open was inside the prior day’s value area and above the T+2 range. There was no gap between the previous day’s RTH range and the RTH open. Long traders tried to lift the auction above VWAP in the opening hour. However, trapped long supply above 3992.50 could not be fully absorbed. $ES_F rotated down underneath VWAP and the overnight low as supply liquidated. The selloff was OTFD for several TPO periods along the -2 standard deviation. Trapped shorts covered in the prior day’s lower set of single prints to stabilize the liquidation. However, $ES_F could not trade above VWAP and another rotation to the -2 standard deviation followed. Shorts covered at 3932.50, a new RTH session low. The NYSE close was directly inline with the ETH close.