ESM22 Daily Debrief 03/17/2022
Price Performance
Futures
Stocks (Top 5)
$AAPL: +0.65%
$MSFT: +0.28%
$GOOGL: +0.42%
$AMZN: +2.70%
$TSLA: +3.73%
Top-Down Analysis
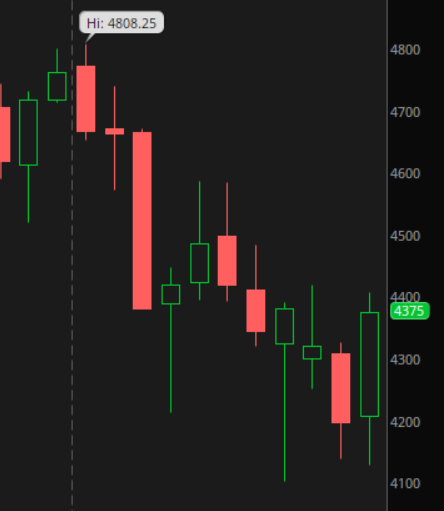
Monthly Chart: ESM22 is still OTF down over the past three months. However, today’s positive rally just flipped the month of March green.
Weekly Chart: ESM22 is still on a downtrend since the week of 01/07/2022. However, the upside momentum this week is close to taking out the 4411.50 high from the week of 03/04/22.
Daily Chart: Yesterday’s close was above the channel that began forming on 03/07/2022. This range is now creating a new ascending trend with higher highs on the daily time frame. Today’s gap up and close is posing a threat to the 4411.50 high from 03/03/22.
ESM22 Technicals
03/17/22 Session
Electronic Trading Hours (ETH)
Overnight Session:
At yesterday’s close, the market’s big money players took inventory long. The overnight session opened inside of yesterday’s price range and above the value area. The overnight inventory experienced a short correction. It fell as much as 40 points and after the London open, the market began to find some acceptance in the higher end of yesterday’s value area.
ONO: 4361
ONH: 4363.5
ONL: 4320.25
ONRange: 43.25
Regular Trading Hours (RTH)
Initial Balance Session:
During the IB period, price rallied to the upside. Despite some downside continuation of about 5 points, supply shut off and short covering was able to push the market up +25 points. All the losses from the ON session were erased and longs were able to reach a new HOD. This move to the upside pushed ESM22 above yesterday’s value area. The market internals were bullish. $ADD was steadily rising throughout the session. The aggregate of the Top 5 ($AAPL, $MSFT, $GOOGL, $AMZN, $TSLA) was positive, as well. The S&P 500 heat map displayed more green than red. As was the case yesterday, supply was met and price stalled between the VAL and POC range (4362.25 - 4371.75) from 03/03/2022.
IBO: 4330
IBH: 4364
IBL: 4325.75
IBC: 4358
IBRange: 38.25
Remaining Session:
Immediately after the IB period, the market underwent an inventory correction. This move took out weak-handed longs and retested acceptance within yesterday’s value area. Supply shut off at 4334 and the retest failed. The market continued its rally to the upside as longs were able to take out the HOD from IB, as well as yesterday’s HOD to close above 4400.
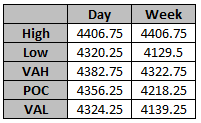
H: 4406.75
L: 4334
C: 4402
Here’s this week’s 30 minute chart.


