ESM22 Daily Debrief 03/16/2022

Key Events:
The Federal Reserve approved a rate hike of 0.25 percentage points, the first since December 2018. They anticipate six more rate hikes in 2022.
Top-Down View (TDV)
Monthly Chart: ESM22 is OTF down for the last three months.
Weekly Chart: ESM22 is on a downtrend since the week of 01/07/2022. However, this week is green with a higher high compared to the prior week.
Daily Chart: Since 03/7/22, the daily chart has been forming a channel in the range between 4129-4327. Today’s close was above this channel. This price action is now creating a new ascending trend line of highs on the daily time frame. The Asian open for tomorrow’s session was also outside of the 03/07/2022 channel. Today’s 4367.5 HOD and the 03/03/2022 HOD at 4411.50 are areas to the upside that I will be keeping in mind.
Electronic Trading Hours (ETH)
Overnight Session:
The ON session opened within the previous day’s range and was above the value area. Overnight inventory was long with market makers pushing the price up. At yesterday’s close, the market makers were long and this position continued the upward rise through the overnight. Wholesale continued to move the price up. The Asian open and trading hours were mostly flat. Leading up to the London open, supply got thin and the market makers moved the market up.
Key Price Levels:
WkHi: 4263.50
WkLo: 4129.50
WkVAH: 4237.75
WkPOC: 4219.25
WkVAL: 4181.75
pDayH: 4263.50
pDayL: 4129.50
pDayC: 4253.75
pDayVAH: 4244.50
pDayPOC: 4218.50
pDayVAL: 4182.50
ONO: 4254
ONH: 4314.75
ONL: 4239.25
ONRange: 75.5
Regular Trading Hours (RTH)
Initial Balance Session:
During the RTH open, the market internals were all strong. There were no outside sellers. The market makers were trapping shorts to push the price up to new highs for the session.
IBO: 4294
IBH: 4339.5
IBL: 4293
IBRange: 46.5
Remaining Session:
The remaining RTH session began with supply slowly overwhelming demand. Price kept creeping lower and lower as we approached the announcement of the FED’s interest rate decision. On announcement, the market reacted, and price fell sharply. This appeared to be a stop run and eventually supply shut off around 4242.25. Short covering ensued and the market began to rise slowly and with plenty of chop. This rally continued into the close and end of RTH.
H: 4367.25
L: 4242.25
C:4349.50
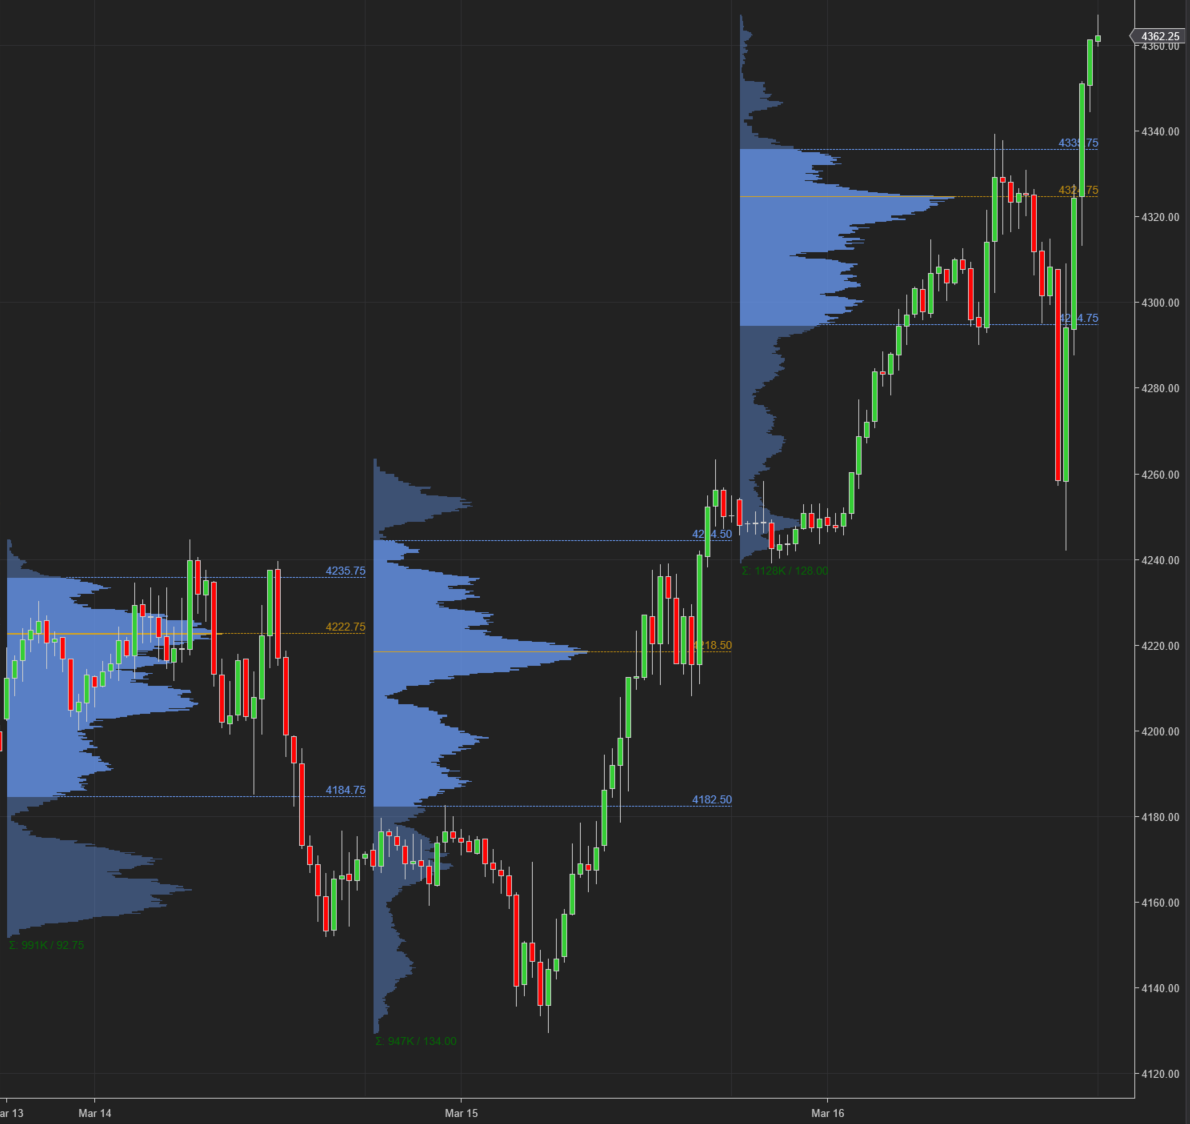
Here is the current week’s 30 minute chart.