
03/13/2023 Synopsis
Concerns over regional banking pulled stocks and Treasury yields lower. Aggregate bond indices gapped up for the 2nd straight session.

Market Overview

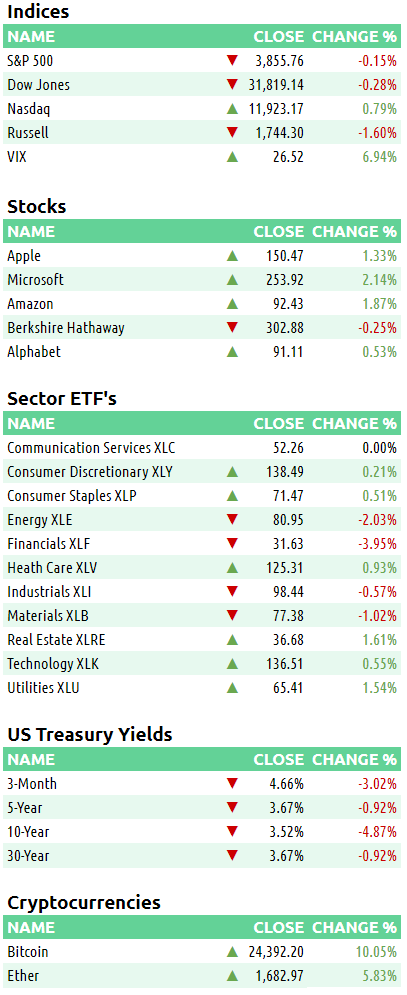
The S&P 500 was down in today’s session. 6/11 sectors were positive.
Outperforming Index: Nasdaq 100 QQQ 0.00%↑
Underperforming Index: Russell 2000 IWM 0.00%↑
Strongest Sector: Utilities XLU 0.00%↑
Weakest Sector: Financials XLF 0.00%↑
Top Stock: Illumina ILMN 0.00%↑
Poorest Stock: First Republic Bank FRC 0.00%↑
The US Dollar index increased | decreased | did not move.
$DXY: 103.62 (-0.97%)
US Treasury yields retreated.
2-year: 3.98% (-61 bps)
10-year: 3.57% (-13 bps)

Here are some of today’s closing prices.
E-mini S&P 500 Top-Down Analysis

📈 Below are the monthly, weekly, daily and 4-hour charts for $ES_F.
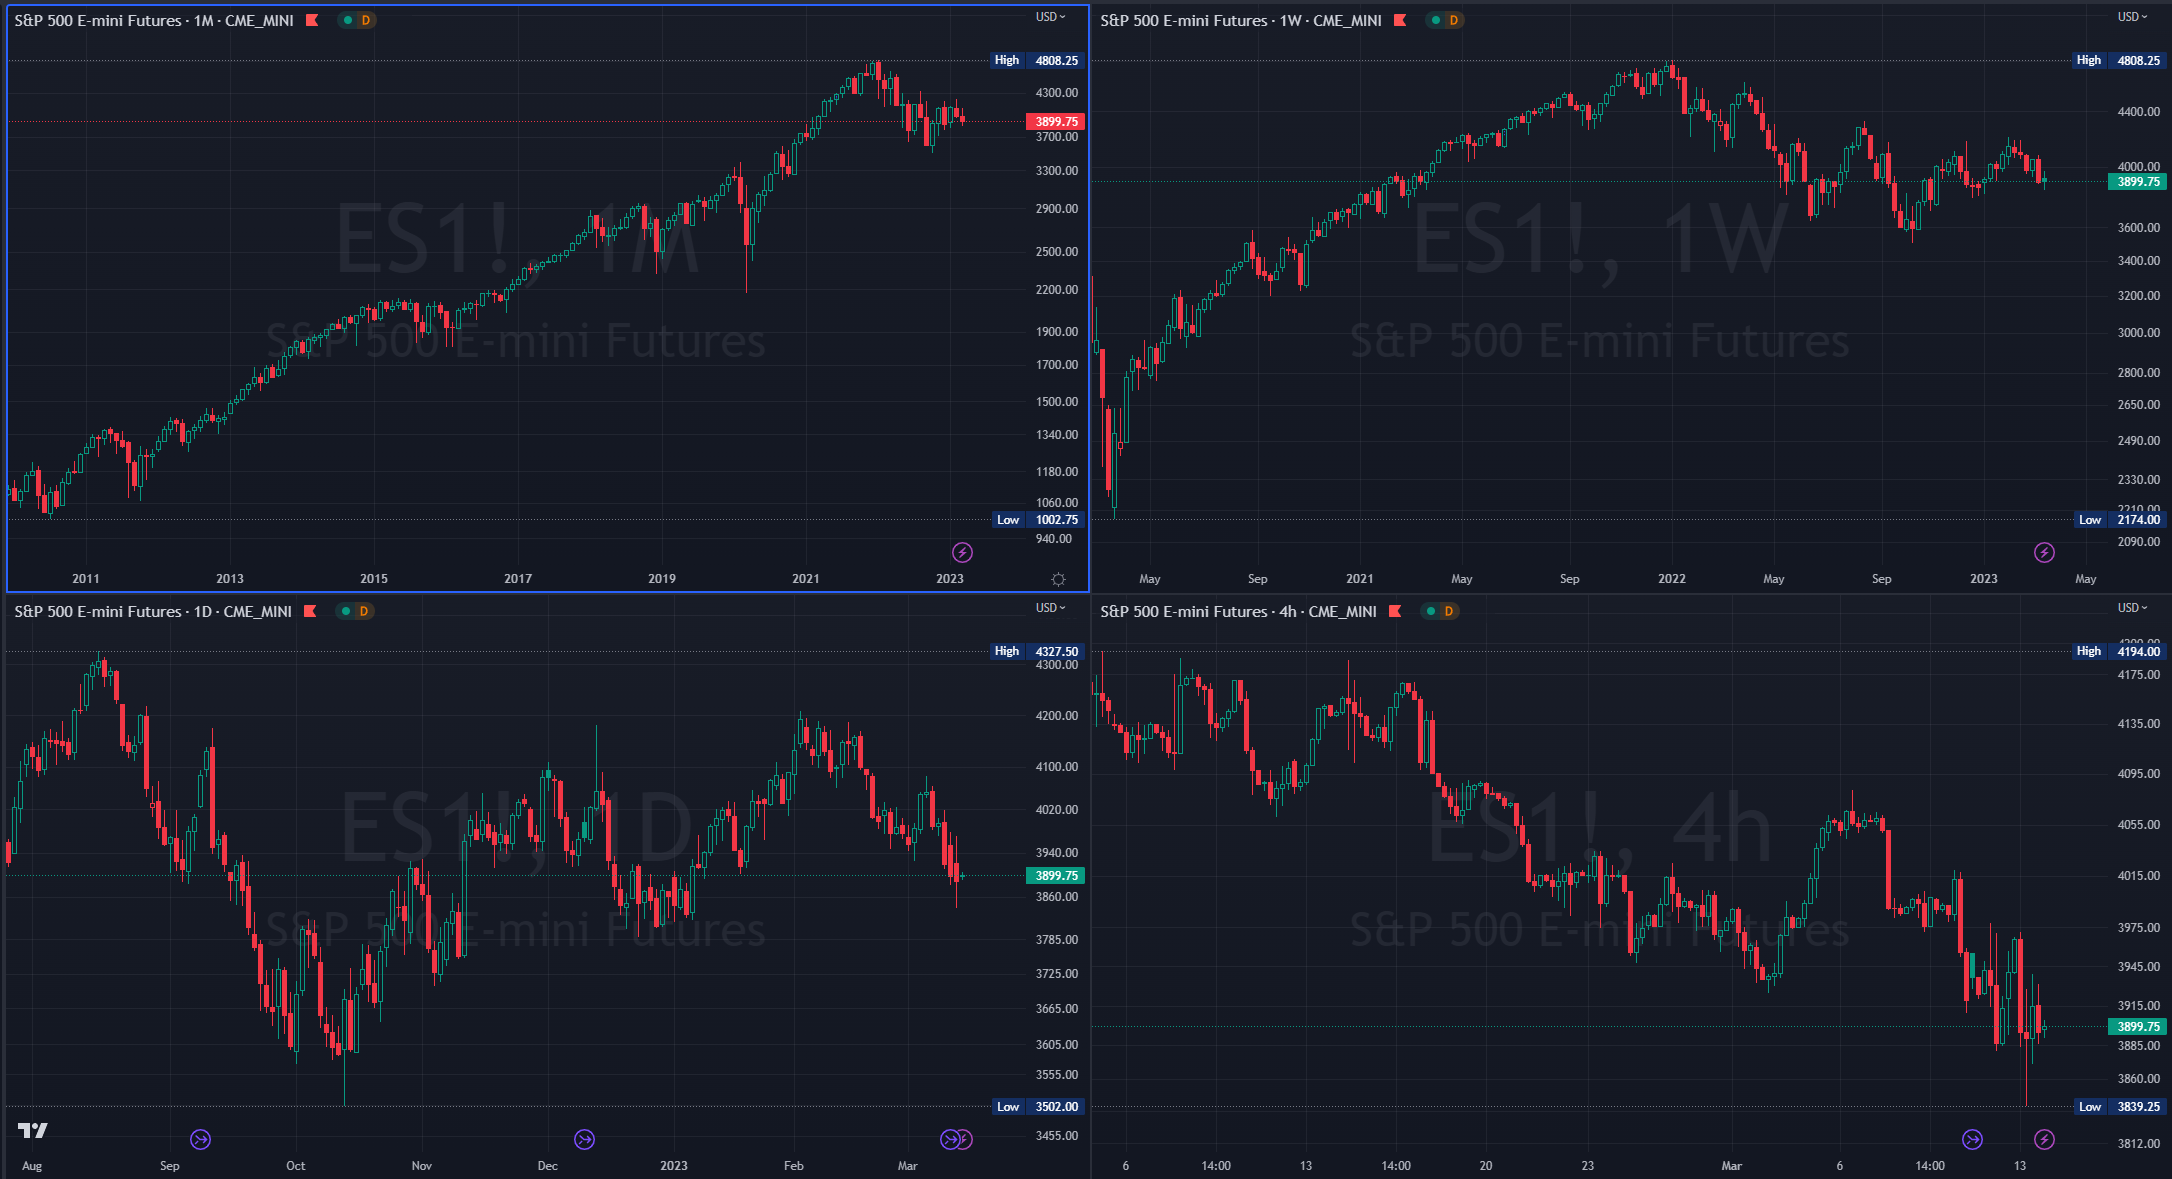
Monthly: Balance / consolidation. [Last 3-months: 3814.5 - 4208.5].
Weekly: Outside down week.
Daily: OTFD. [Nearest high: 3971.50]
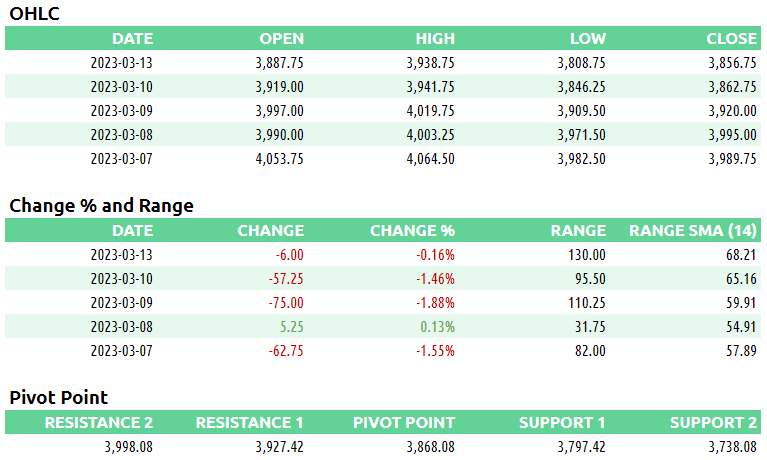
E-mini S&P 500 Metrics
Recent Performance & Technicals

E-mini S&P 500 Volume/Market Profile
ES Composite Volume Profile (5 days)
📈 Here is a chart of the past five sessions with a composite ETH Volume Profile:
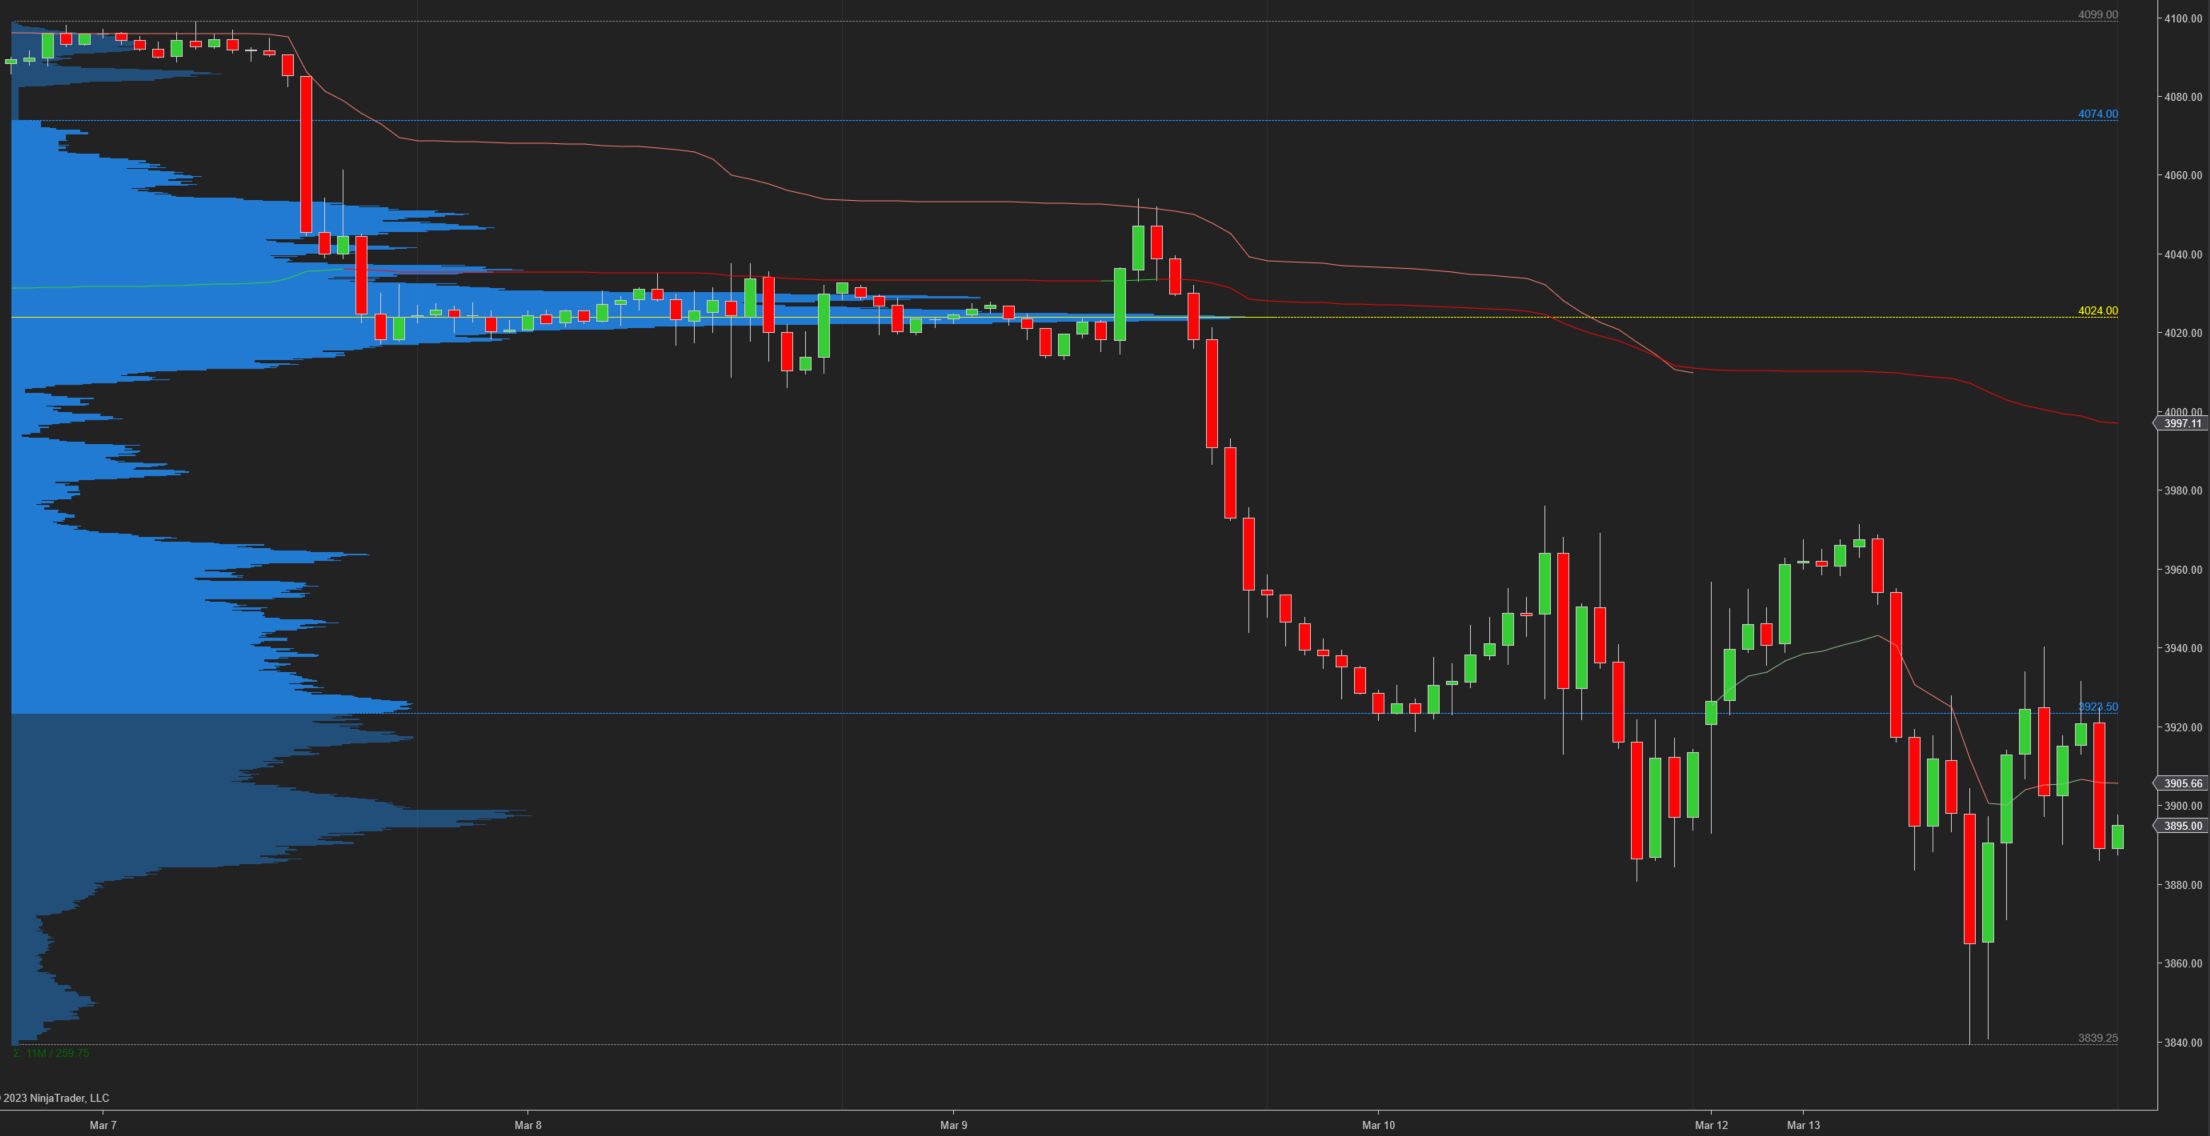
ES ETH/RTH Split Volume Profile (5 days)
📈 Here is a chart of the past five sessions with a daily ETH/RTH split Volume Profile:

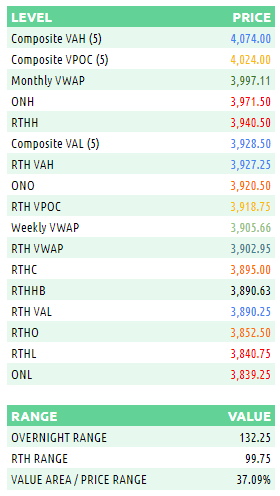
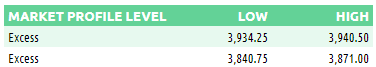
ES Market/Volume Profile Levels
Session Recap
Electronic Trading Hours (ETH)
Overnight Session:
Wholesale was short at the prior day’s close. The overnight open was inside the prior day’s value area. Inventory during the overnight session was long initially but then corrected short after London opened. Wholesale was distributing over VWAP early on but buyers couldn’t take out the offer at 3971.50 from trapped longs. Then the market sold off and fell 130-points overnight. At 3839.25, a weak low from December 28th, there was a bid from trapped shorts which held and shorts covered. Overnight VPOC was 3900.
Regular Trading Hours (RTH) Session:
The RTH open was below the prior day’s price range and below the T+2 low. There was a gap down between the previous day’s RTH range and the RTH open. $ES_F couldn’t fall beneath the overnight low in the first 30-mins of NYSE trading. After failing to take out trapped short buyers at 3840.75, the market rallied on short covering. $ES_F filled the overnight gap and got above the prior day’s value area momentarily. After a 100-point rally, trapped long supply was hit at 3940.50. $ES_F rotated inside a 60-point range as trapped shorts kept price action above the prior day’s low for the remainder of the session.