
03/10/2023 Synopsis
Equities and yields got crushed on strong payrolls and regional bank concerns. Bonds rallied.

Market Overview

The S&P 500 was down in Friday’s session. 0/11 sectors were positive.
Outperforming Index: Dow Jones DIA 0.00%↑
Underperforming Index: Russell 2000 IWM 0.00%↑
Strongest Sector: Consumer staples XLP 0.00%↑
Weakest Sector: Real estate XLRE 0.00%↑
Top Stock: Intel INTC 0.00%↑
Poorest Stock: Signature Bank SBNY 0.00%↑
The US Dollar index decreased.
$DXY: 104.63 (-0.61%)
US Treasury yields retreated.
2-year: 4.59% (-28.1 bps)
10-year: 3.70% (-20.6 bps)

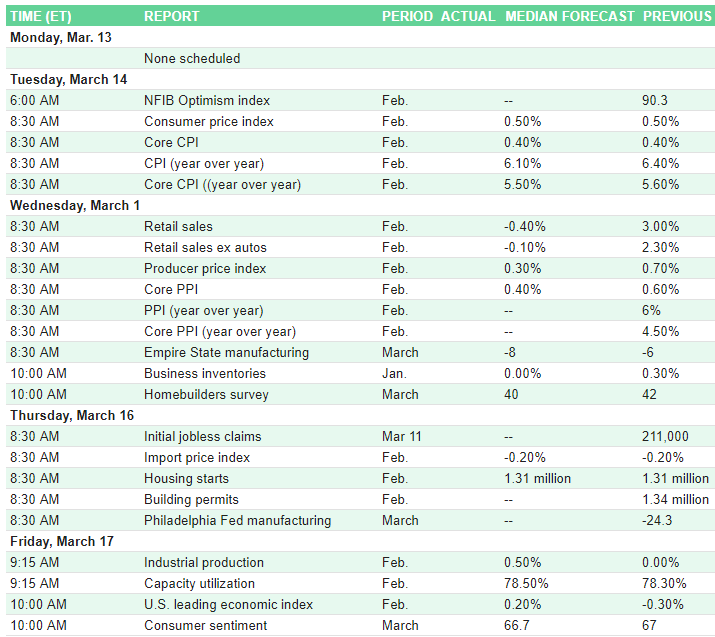
Events this week:
Here are some of Friday’s closing prices.

E-mini S&P 500 Top-Down Analysis

📈 Below are the monthly, weekly, daily and 4-hour charts for $ES_F.

Monthly: Balance / consolidation. [Last 3-months: 3814.5 - 4208.5].
Weekly: Outside down week.
Daily: OTFD and fell into balance area from mid-December. [3788.5 - 3919.75].
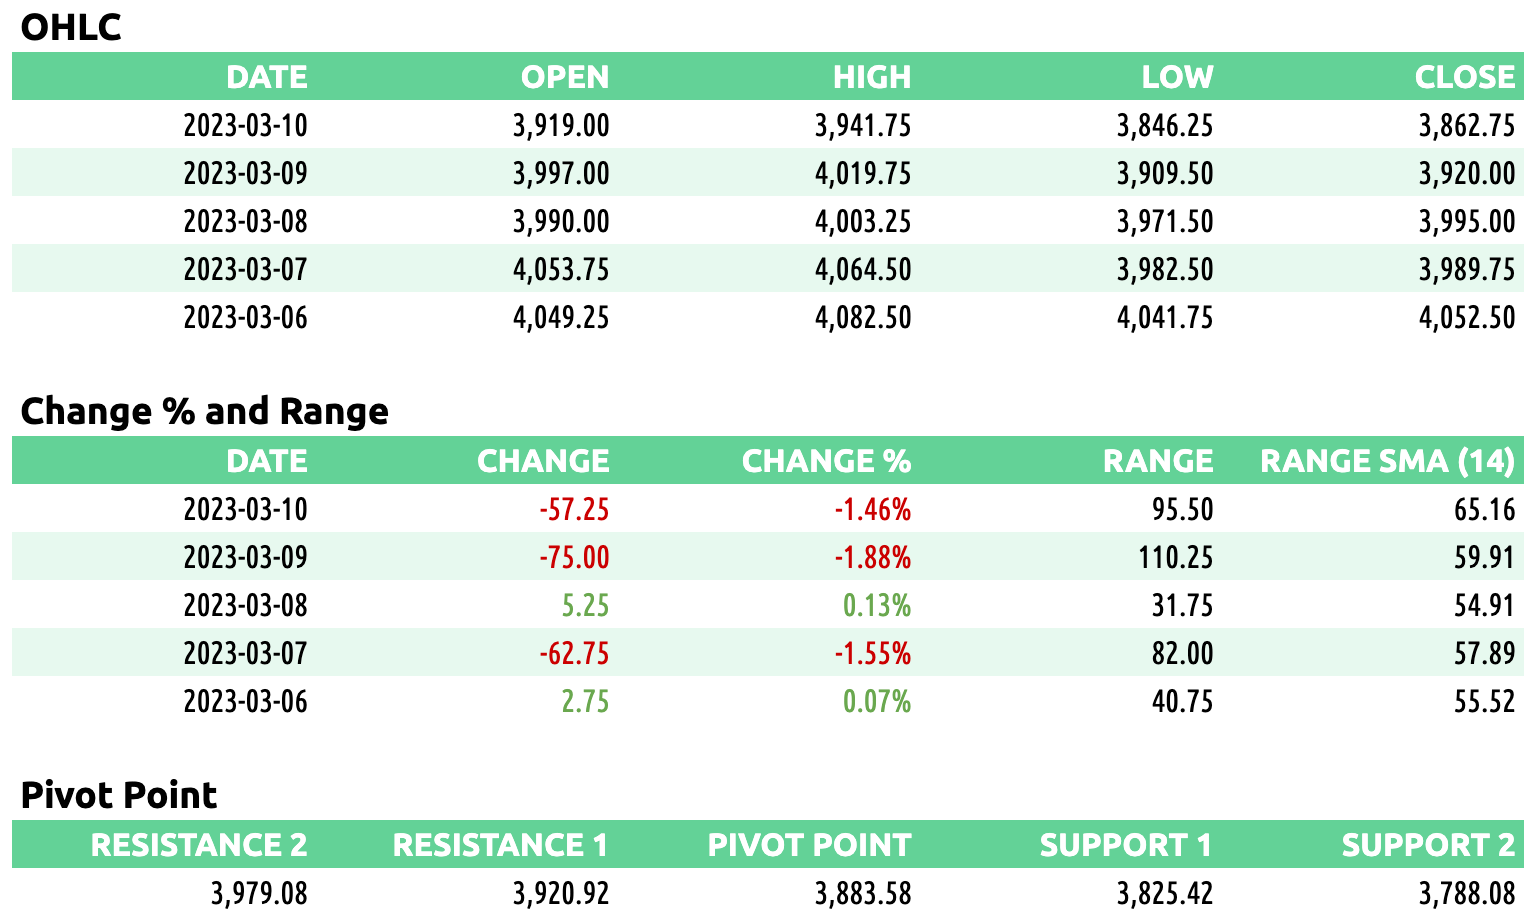
E-mini S&P 500 Metrics
Recent Performance & Technicals

E-mini S&P 500 Volume/Market Profile
ES Composite Volume Profile (5 days)
📈 Here is a chart of the past five sessions with a composite ETH Volume Profile:

ES ETH/RTH Split Volume Profile (5 days)
📈 Here is a chart of the past five sessions with a daily ETH/RTH split Volume Profile:

ES Market/Volume Profile Levels


Session Recap
Electronic Trading Hours (ETH)
Overnight Session:
Wholesale was short at the prior day’s close. The overnight open was inside the prior day’s value area. Inventory during the overnight session was short below the prior day’s close and low. There wasn’t much demand overnight so wholesale was trying to find buyers. At 3884.25, $ES_F fell into a balance zone from mid-December to early-January and there were bids from trapped shorts. These bids held and $ES_F rotated up. When the NFP figures were released, after the typical volatility, $ES_F continued to climb up to new highs for the overnight session. At 3941.75, trapped long offers held up and $ES_F backfilled down 30-handles as wholesale waited for new buyers to come in. Overnight VPOC was 3912.
Regular Trading Hours (RTH) Session:
The RTH open was inside the prior day’s value area and below the T+2 low. There was no gap between the previous day’s RTH range and the RTH open. $ES_F sold off and fell beneath the overnight and prior day’s low in the first half hour of NYSE trading. At 3878.50, supply ran out as trapped short bids were present from a January 6th set of single prints. The auction rotated back up but failed to get into the prior day’s value area. At 3934.75, demand faded in the face of trapped long supply. The auction fell 90-handles over the next 2.5 hours. $ES_F bottomed at 3946.25 where shorts began to cover. The auction rotated in a 40-point range for the remainder of the session. ETH closed at 3879, nearly 20-points higher than the NYSE close.