
03/07/2023 Synopsis
Risk assets tumbled on the heels of Fed Chair Jerome Powell’s hawkish testimony to the Senate Banking Committee.

Market Overview

The S&P 500 was down in today’s session. 0/11 sectors were positive.
Outperforming Index: Russell 2000 IWM 0.00%↑
Underperforming Index: Dow Jones DIA 0.00%↑
Strongest Sector: Consumer Staples XLP 0.00%↑
Weakest Sector: Financials XLF 0.00%↑
Top Stock: Dish Network DISH 0.00%↑
Poorest Stock: DXC Technology DXC 0.00%↑
The US Dollar index took off.
$DXY: 🟢 105.62 (+1.27%)
US Treasury yields on T-bills and notes advanced.
2-year: 🟢 5.01% (+12.5 bps)
10-year: 🟢 3.97% (+0.6 bps)

Here are some of today’s closing prices.

E-mini S&P 500 Top-Down Analysis

📈 Below are the monthly, weekly, daily and 4-hour charts for $ES_F.
Monthly: Balance / consolidation. [Last 3-months: 3814.5 - 4208.5]
Weekly: OTFD ended. Balance [3925 - 4089.25]
Daily: Rangebound [3925 - 4082.50]. Closed back under the 50-day MA.
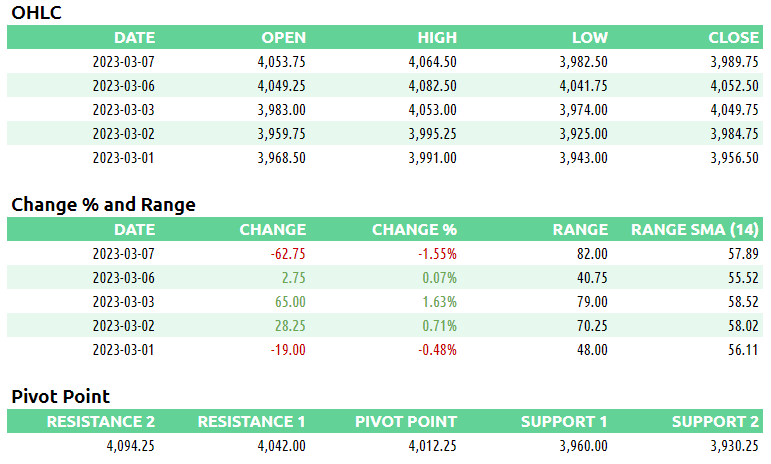
E-mini S&P 500 Metrics
Recent Performance & Technicals

E-mini S&P 500 Volume/Market Profile
ES Composite Volume Profile (5 days)
📈 Here is a chart of the past five sessions with a composite ETH Volume Profile:

ES ETH/RTH Split Volume Profile (5 days)
📈 Here is a chart of the past five sessions with a daily ETH/RTH split Volume Profile:

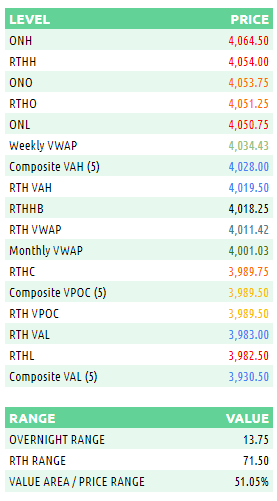
ES Market/Volume Profile Levels

Session Recap
Electronic Trading Hours (ETH)
Overnight Session:
Wholesale was long at the prior day’s close. The overnight open was below the prior day’s value area. Inventory during the overnight session was long over the prior day’s close for most of the session. Heading into RTH it corrected short. Long inventory above 4064.50 was supply and resistance overnight. $ES_F made a new overnight low right before RTH at 4050.75. Overnight VPOC was 4059.25.
Regular Trading Hours (RTH) Session:
The RTH open was below the prior day’s value area and inside the T+2 range. There was no gap between the previous day’s RTH range and the RTH open. The opening hour was filled with indecision by investors. Once Jerome Powell’s Senate comments began, sellers began to unload on the bid. $ES_F dropped nearly 40-points in B-period to fall beneath the overnight and prior day’s low. There was a bid and short covering at 4012.25 and 4004.25. Once these trapped shorts were absorbed by supply, the auction dropped even further to fall beneath the T+2 low. At 3982.50. there was another bid where shorts covered and stabilized $ES_F. The ETH session ended 1-tick above where the NYSE session closed for $ES_F.