
02/24/2023 Synopsis

Market Overview
Every equity index was down on Friday. The Nasdaq was the worst performer while the Russell held up best. The S&P 500 is approaching its 200-day MA. Only three S&P sectors were up on Friday. Materials led and real estate lagged.
US Treasury yields were all green Friday. The 2-year moved 11.8 bps higher to 4.82%. The 10-year climbed 6.4 bps higher to 3.95%. Below is a chart with a comparison of the yield on several Treasuries of varying duration.

The US Dollar index $DXY gained 0.65% to 105.26. If it can take out 105.63, the 200-day MA is the next level to watch.
Here are some of Friday’s closing prices.

E-mini S&P 500 Top-Down Analysis

📈 Below are the monthly, weekly, daily and 4-hour charts for $ES_F.

M/M: January was an inside month as all price action was contained inside December’s high and low. The past 3-months have been in balance.
W/W: $ES_F failed to trade above the prior week’s high for the third week in a row and is OTFD.
D/D: $ES_F failed to trade above the prior day’s high and closed beneath its low.
E-mini S&P 500 Metrics
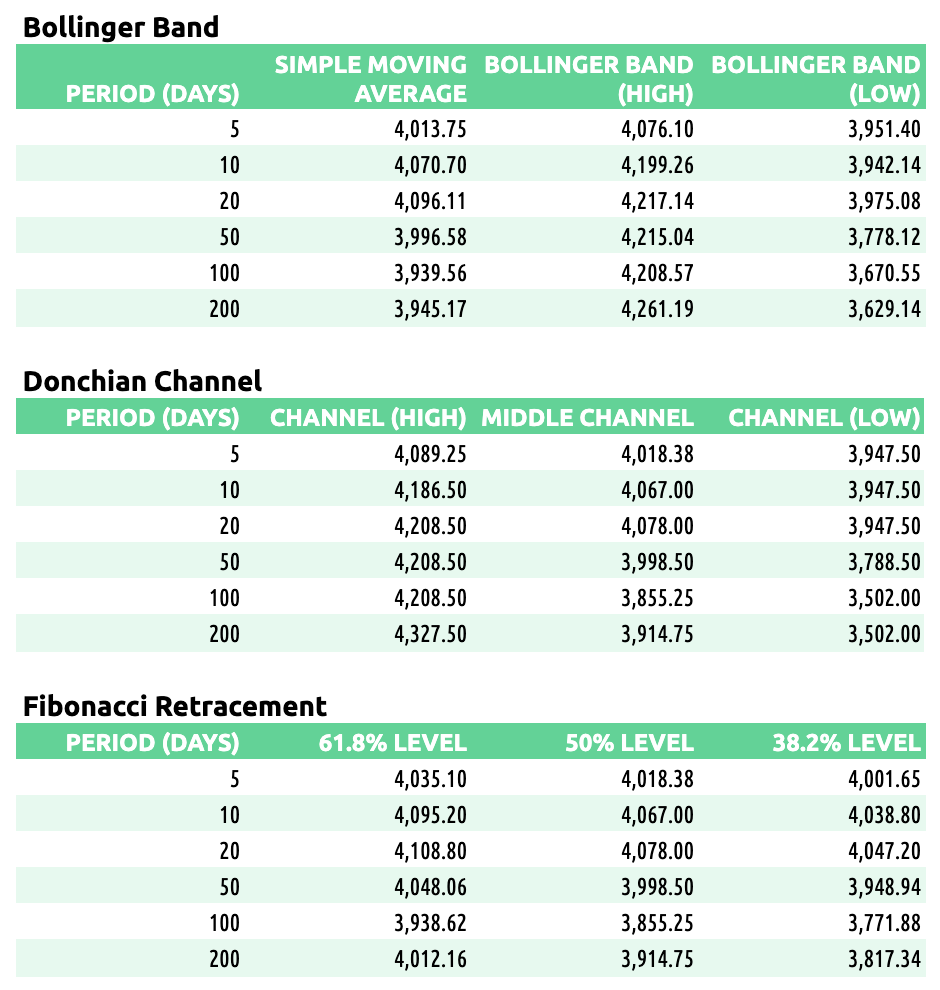
Recent Performance & Technicals

E-mini S&P 500 Volume/Market Profile
ES Composite Volume Profile (5 days)
📈 Here is a chart of the past five sessions with a composite ETH Volume Profile:

ES ETH/RTH Split Volume Profile (5 days)
📈 Here is a chart of the past five sessions with a daily ETH/RTH split Volume Profile:

ES ETH/RTH Split Market/Volume Profile (Friday)
📈 Here’s a TPO chart of Friday’s session with ETH/RTH split Market/Volume Profile:

ES Market/Volume Profile Levels

RTH Weak High/Low: n/a
RTH Single Prints: n/a
RTH Excess: 3947.5 to 3949.5; 3982.25 to 3984
RTH Gap: n/a
Session Recap
Electronic Trading Hours (ETH)
Overnight Session:
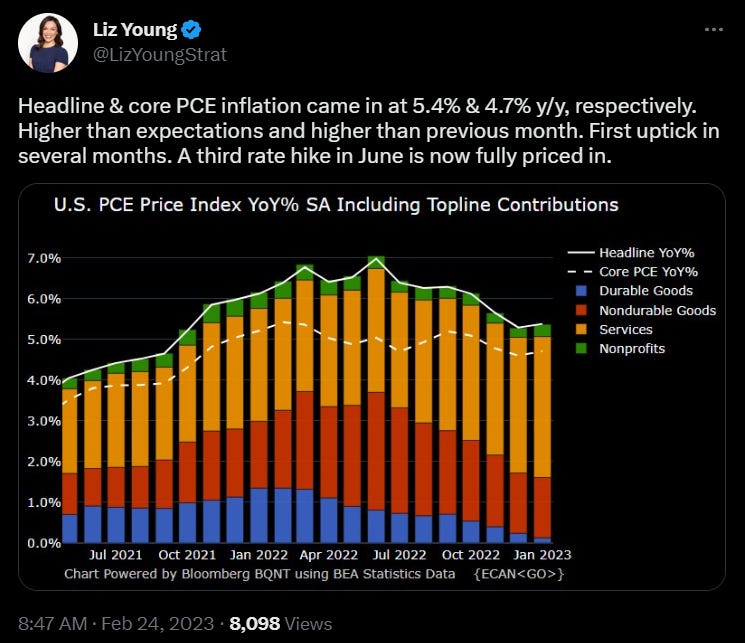
Wholesale was long at the prior day’s close. The overnight open was inside the prior day’s value area. After failing to trade above 4023.25, inventory during the overnight session got short. The auction trended lower by 40-handles throughout the overnight session with wholesale in search of a bid. When the PCE figure was released at 8:30am EST, the $ES_F selloff continued with another drop of 25-points. Supply ran out at 3962.75 and there were areas of imbalance at 3985 and 3970. Overnight VPOC was 3967.
Regular Trading Hours (RTH) Session:
RTH gapped down and was beneath the prior day’s low and T+2 low. At the open, inventory corrected and the overnight gap was filled before responsive supply moved the auction lower. $ES_F was OTFD for the first three TPO periods and fell under the overnight low. At 3947.5, supply ran out and the auction rotated up on short covering. $ES_F got back into the IB range where it rotated inside of for much of the trading session. In K and L-period, longs pushed the auction above the IB range and back into the prior day’s range before hitting trapped longs at 3984. This supply sold the market off nearly 20-points before short covering stabilized the auction into the close.