
02/21/2023 Synopsis
Stocks and bonds continued their slide with the S&P 500 closing beneath its 10-week moving average.

Market Overview

Equity indices all stumbled. The Russell fell the most and the S&P 500 the least. Every S&P sector was negative on the day. Consumer staples led and consumer discretionary lagged.
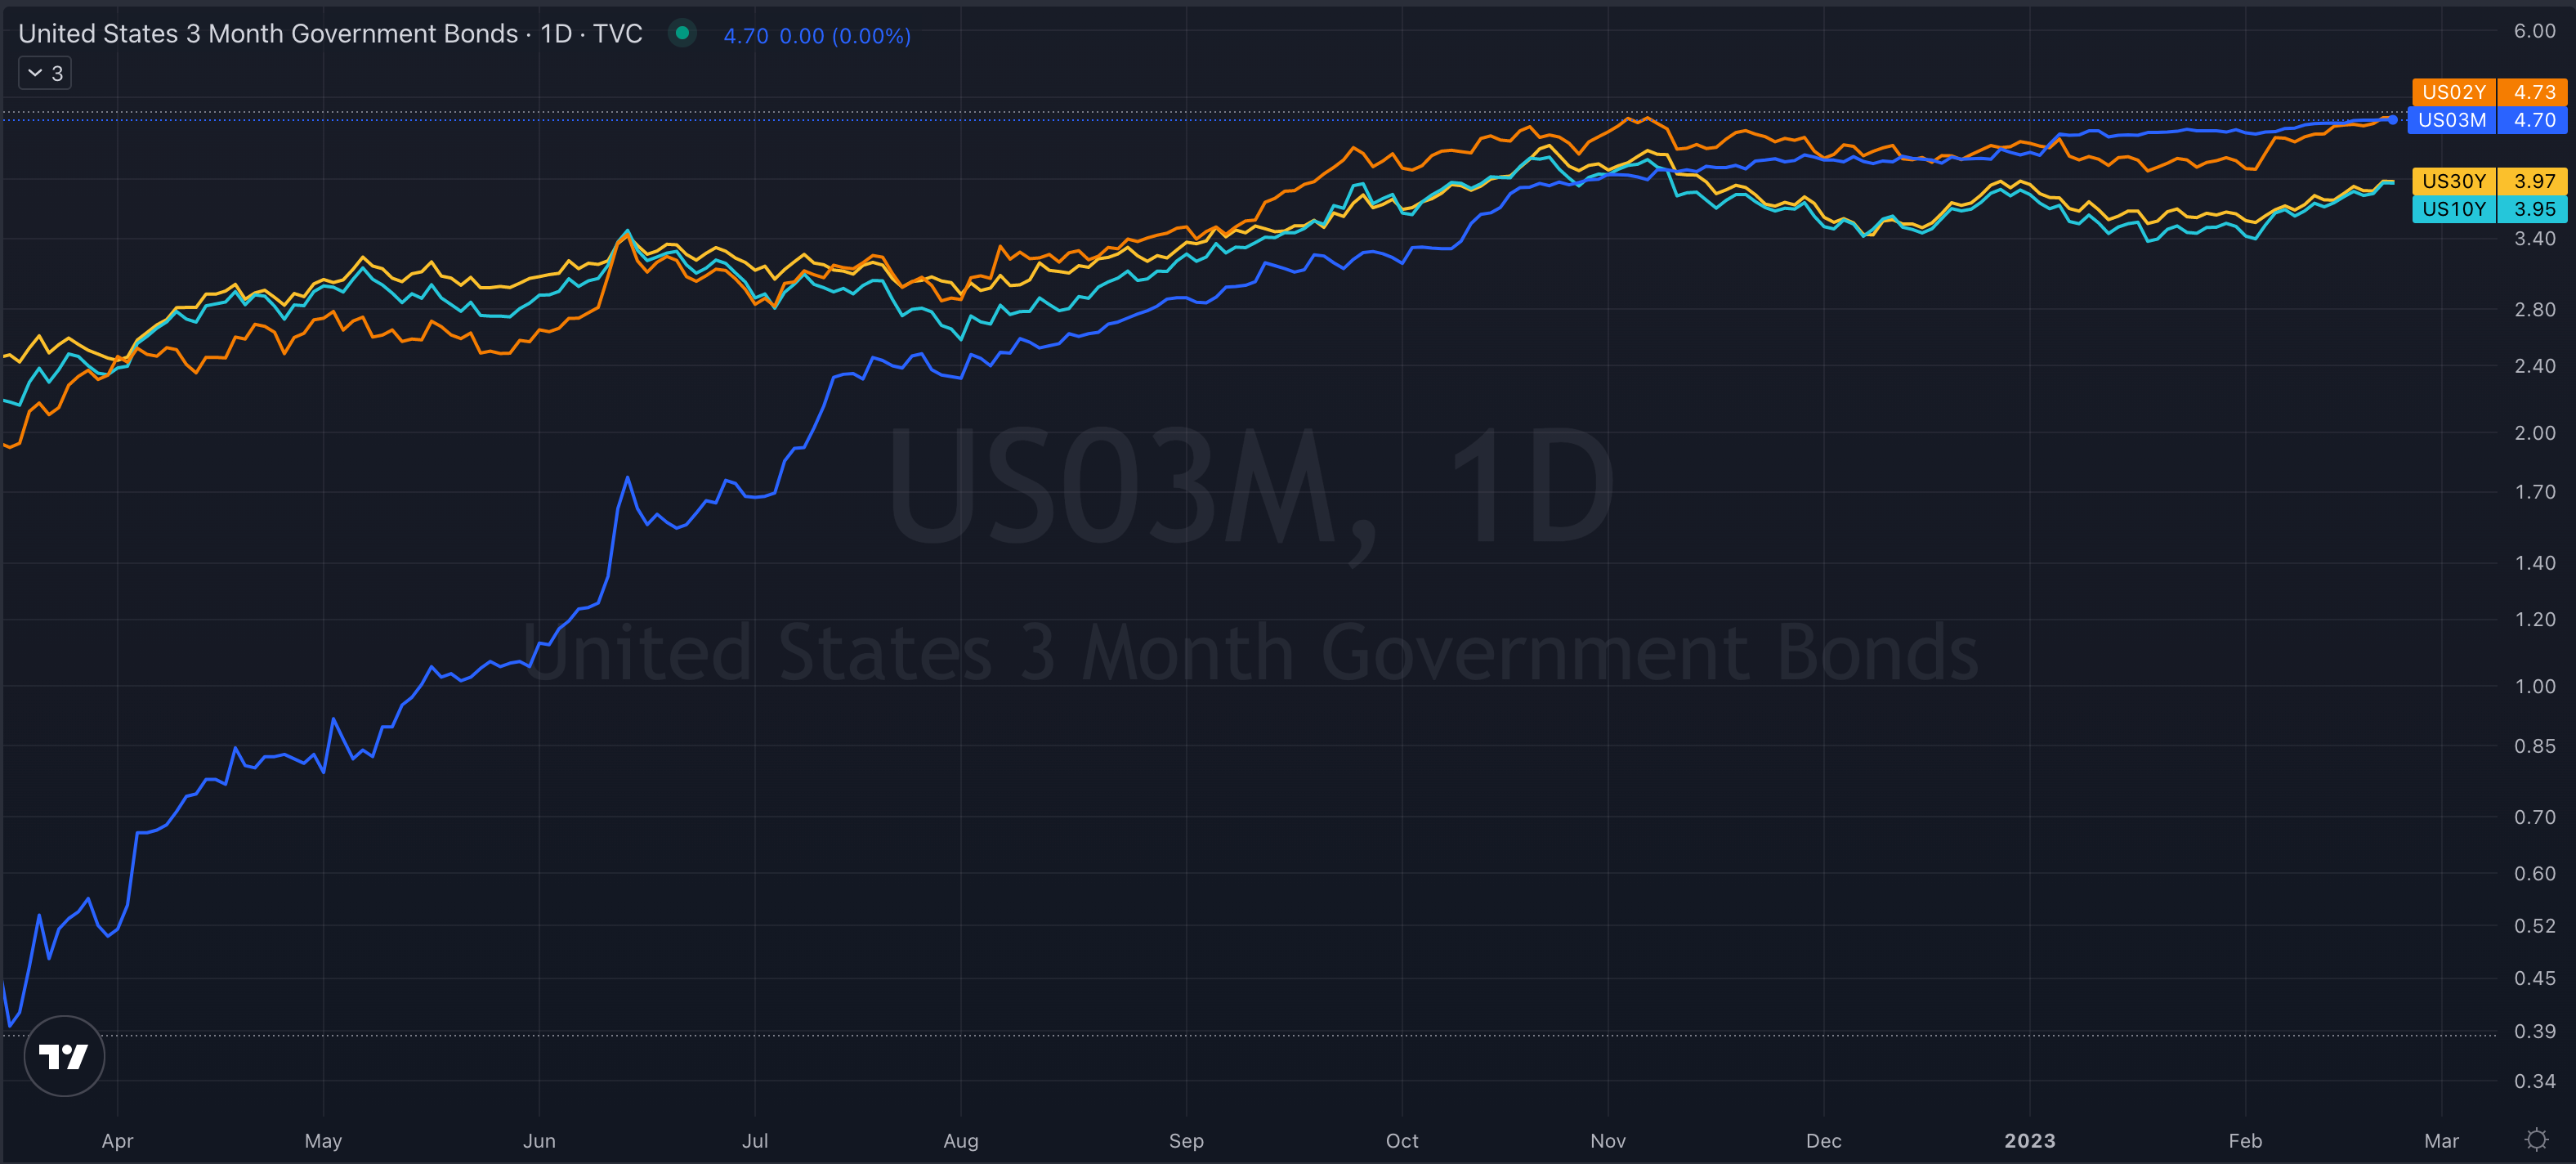
US Treasury yields all ticked higher. The 2-year gained 7.6 bps to go to 4.72%. The 10-year climbed 11.4 bps to 3.95%. Both are the highest levels since November. Below is a chart with a comparison of the yield on several Treasuries of varying duration.
The US Dollar index $DXY gained 0.4% to close at 104.17.
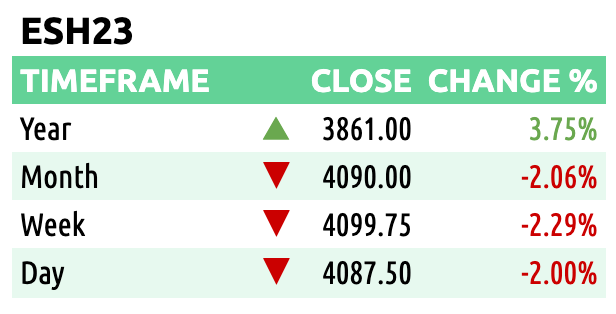
Here are some of today’s closing prices.

E-mini S&P 500 Top-Down Analysis
📈 Below are the monthly, weekly, daily and 4-hour charts for $ES_F.
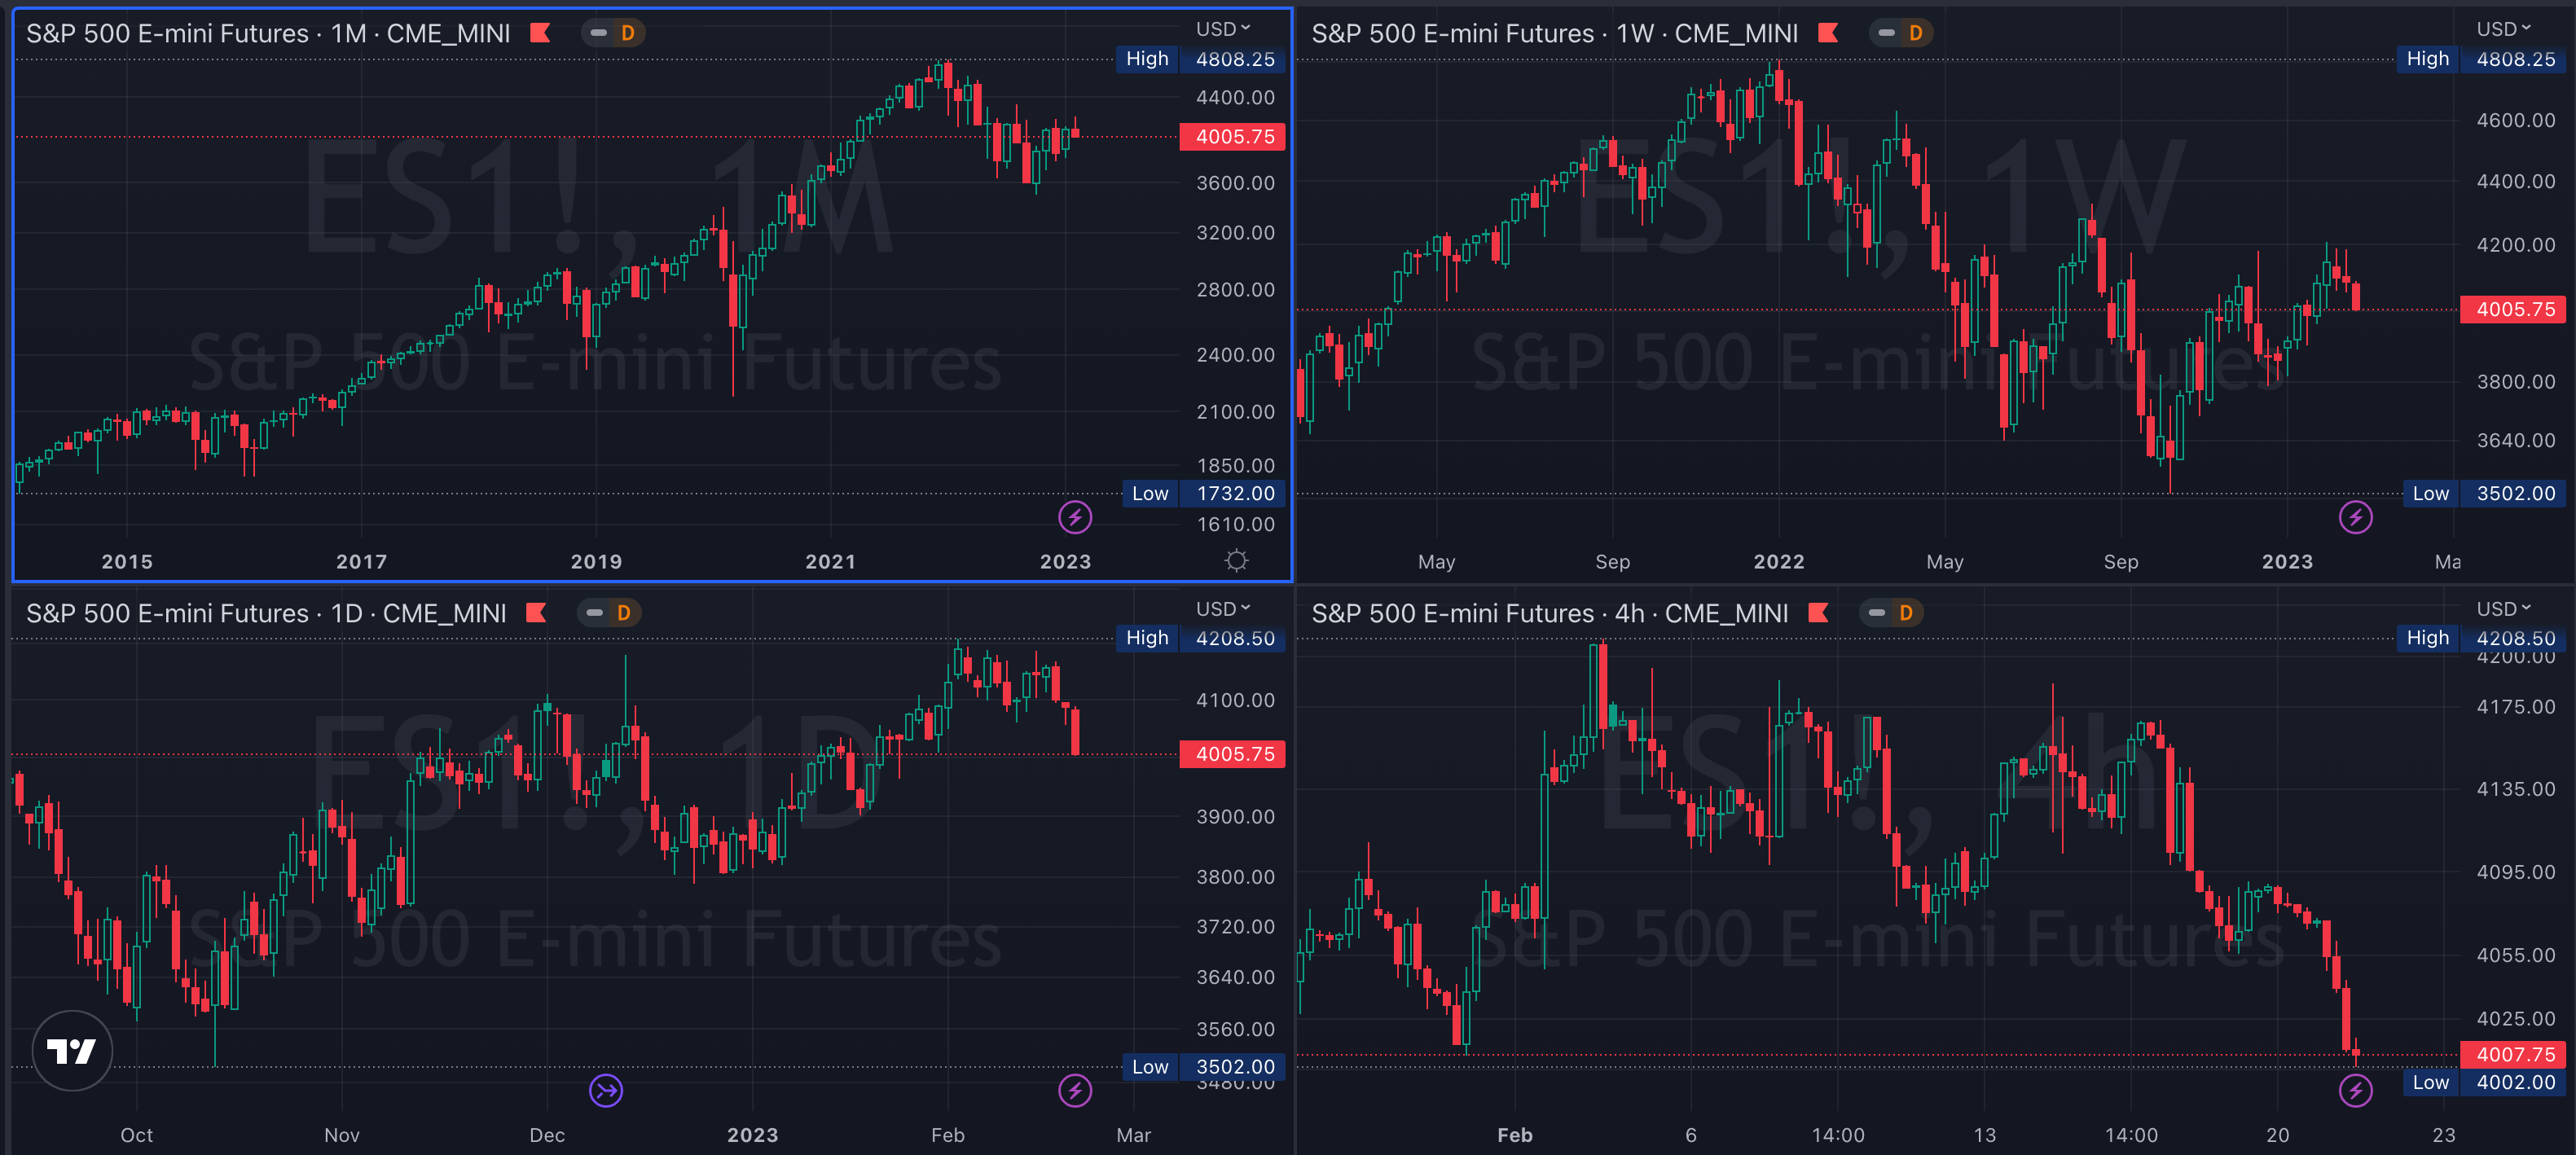
M/M: January was an inside month as all price action was contained inside December’s high and low. The past 3-months have been in balance.
W/W: $ES_F failed to trade above the prior week’s high for the second week in a row.
D/D: $ES_F failed to trade above the prior day’s high again. It’s OTFD and closed at the lowest price since Jan. 20th.
E-mini S&P 500 Metrics
Recent Performance & Technicals


E-mini S&P 500 Volume/Market Profile
ES Composite Volume Profile (5 days)
📈 Here is a chart of the past five sessions with a composite ETH Volume Profile:

ES ETH/RTH Split Volume Profile (5 days)
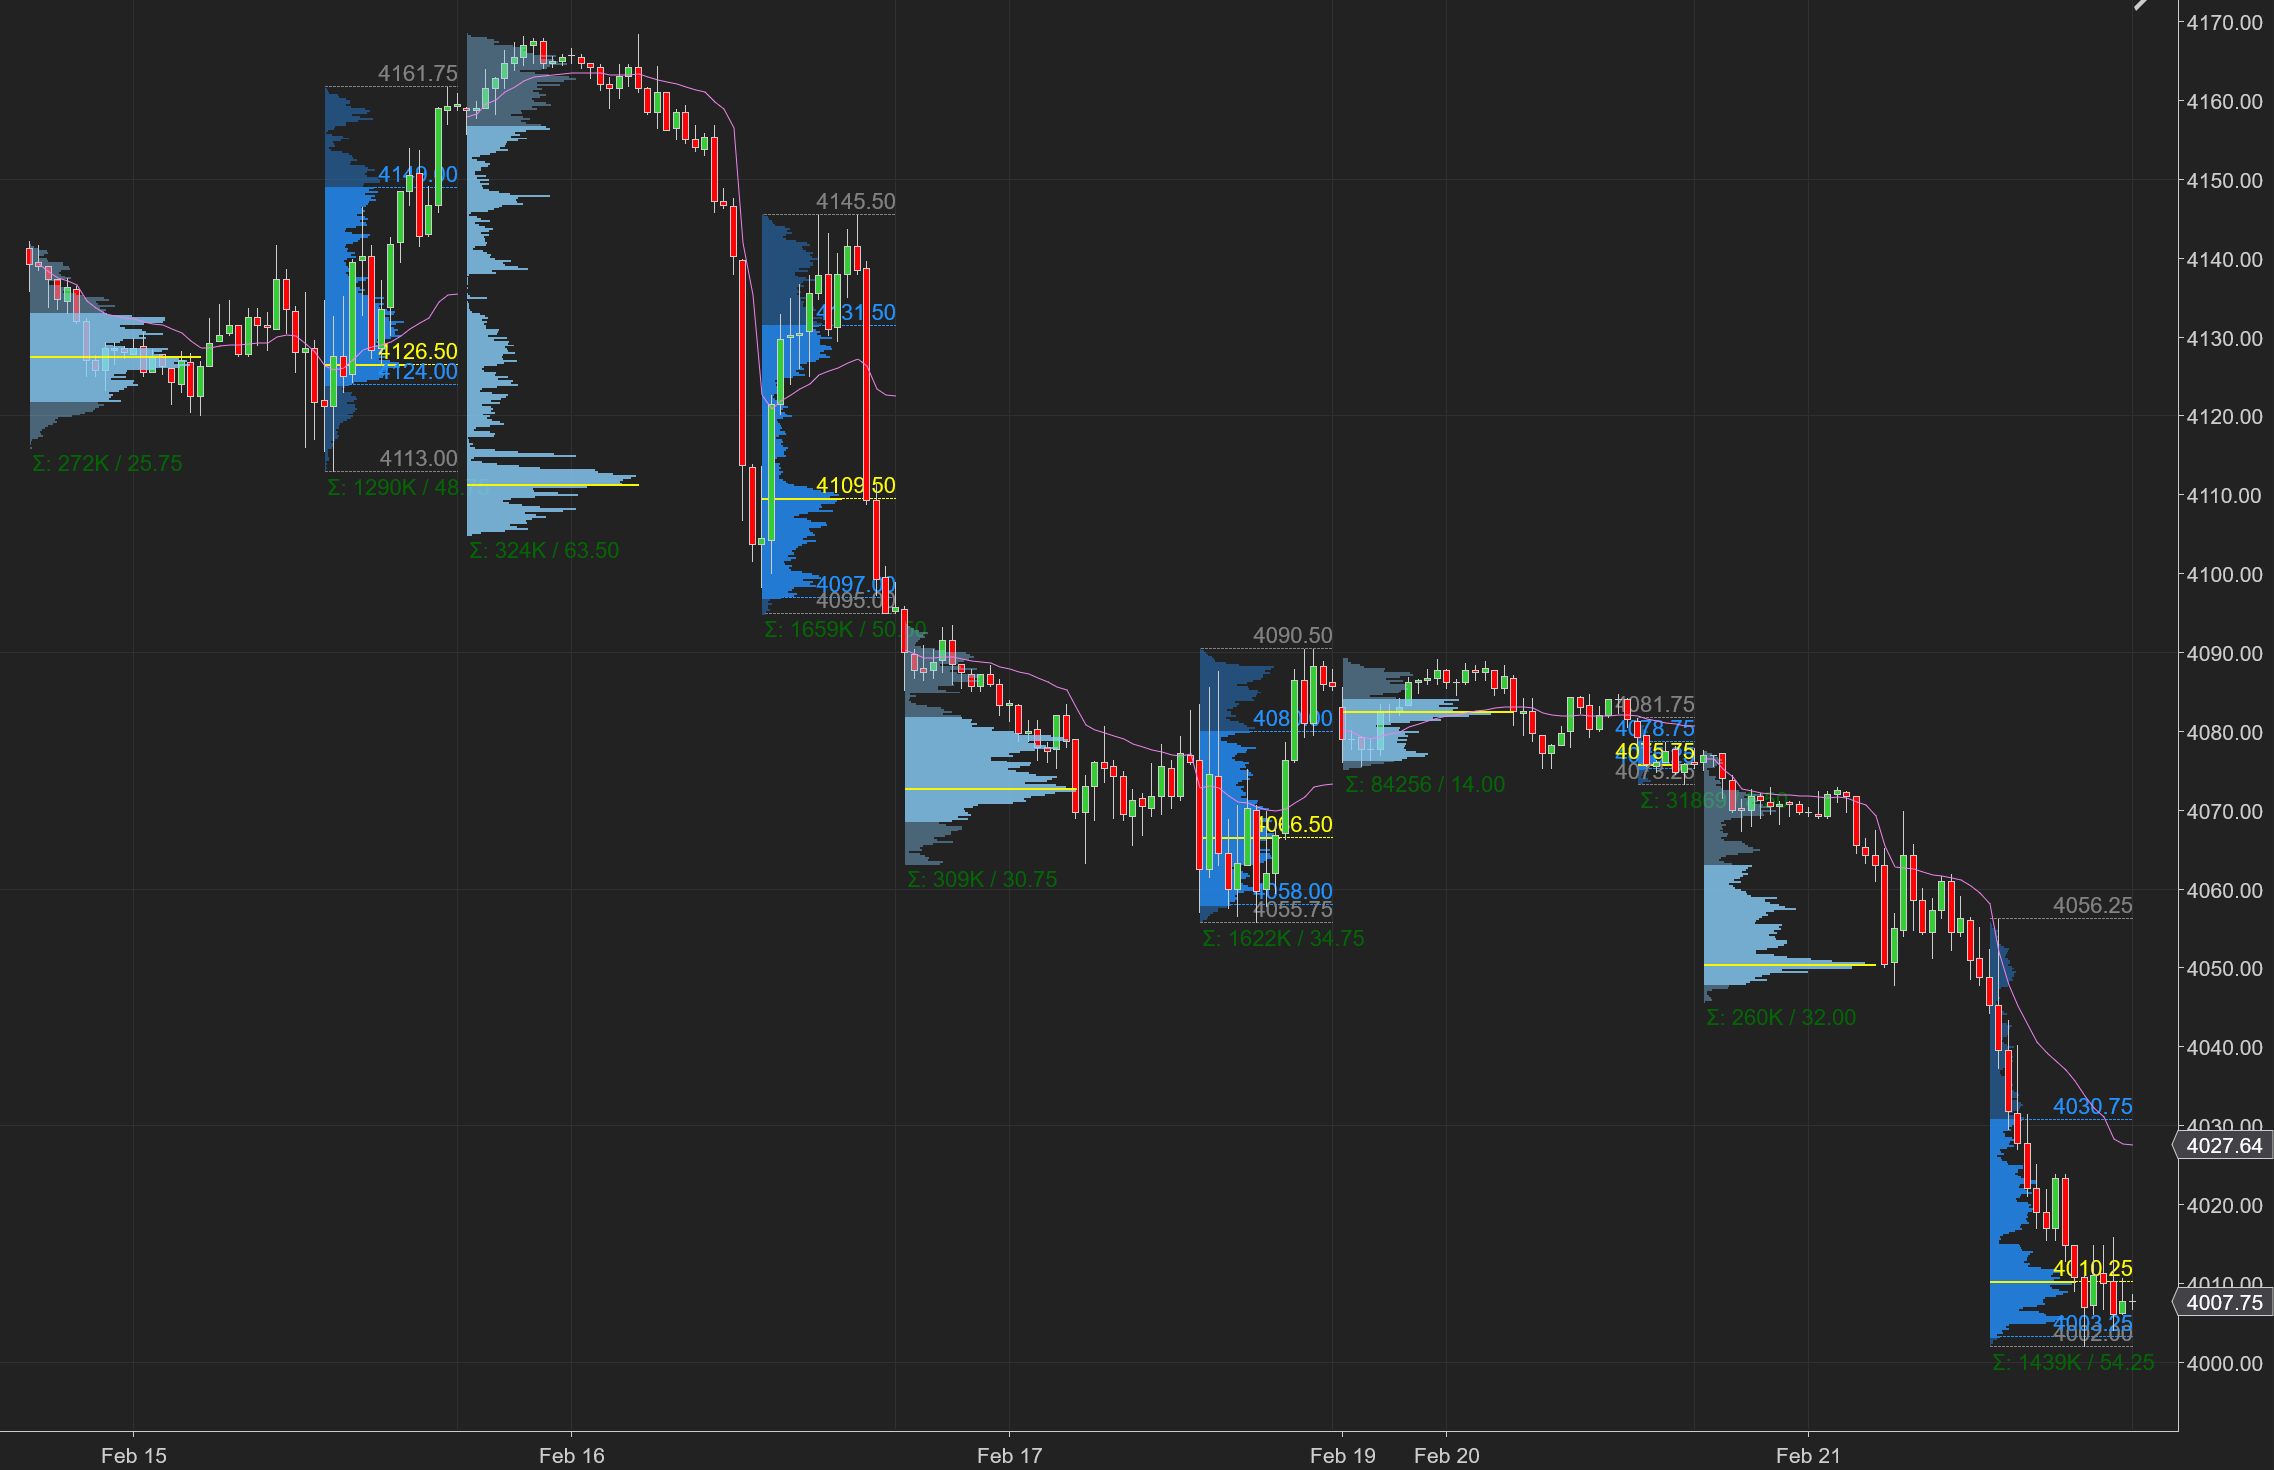
📈 Here is a chart of the past five sessions with a daily ETH/RTH split Volume Profile:
ES ETH/RTH Split Market/Volume Profile (today)
📈 Here’s a TPO chart of today’s session with ETH/RTH split Market/Volume Profile:

ES Market/Volume Profile Levels

RTH Weak High/Low: n/a
RTH Single Prints: 4025.25 to 4027
RTH Excess: 4002 to 4004; 4043.5 to 4056.25
RTH Gap: n/a
Session Recap
Electronic Trading Hours (ETH)
Overnight Session:
Wholesale was short at Friday’s close. Due to yesterday’s holiday and the NYSE being closed, the Sunday open through the overnight session served as an extended Globex session. Sunday’s open was above Friday’s value area but inside the high. Most of the price action yesterday and in the overnight was below Friday’s close. Longs failed to lift the offer over 4089.25. $ES_F rotated down and briefly dipped underneath Friday’s low. Supply ran out at 4047.75.
Regular Trading Hours (RTH) Session:
RTH gapped down and was underneath Friday’s low and the T+2 low. An inventory correction in A-period filled the gap with Friday. However, trapped long supply was hit at 4056.25, resulting in a selloff that began during the IB period and lasted long after. From A through F-period, $ES_F was OTFD. At 4015.50, there was some responsive buying from shorts. Once the short covering ended, the auction continued to fall further. At 4002, trapped shorts kept the bid from dropping further as they covered and stabilized $ES_F into the end of the session.