02/16/2023 Synopsis
Stocks and bonds fell as PPI came in hotter than expected.
Market Overview
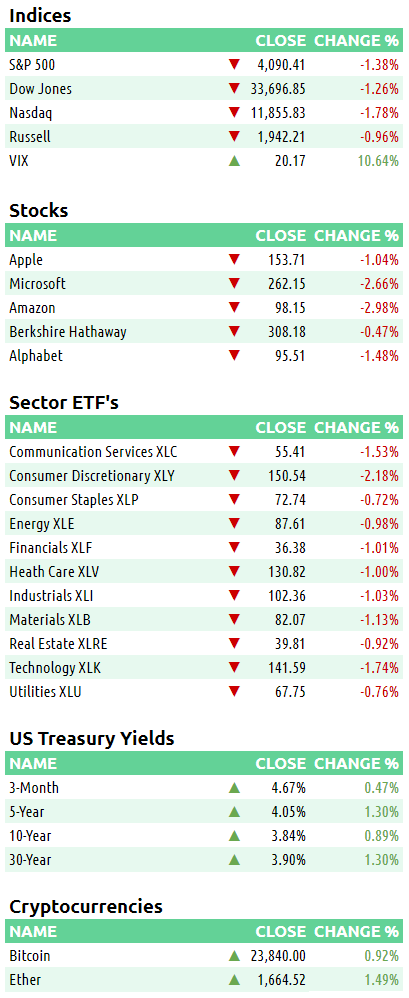
Equity indices all fell in a rollercoaster day. The Nasdaq fell the most while the Russell dropped the least. Every S&P sector finished red. Consumer staples led and consumer discretionary lagged.
US Treasury yields all ticked higher. The 2-year gained 0.9 bps to 4.64%. The 10-year climbed 5.6 bps to 3.87%. Both were the highs for 2023. Below is a chart with a comparison of the yield on several Treasuries of varying duration.
The US Dollar index $DXY gained 0.27% to 104.09.
Here are some of today’s closing prices.
E-mini S&P 500 Top-Down Analysis
📈 Below are the monthly, weekly, daily and 4-hour charts for $ES_F.
M/M: January was an inside month as all price action was contained inside December’s high and low. The past 3-months have been in balance.
W/W: $ES_F just had an inside week with all price action inside the prior week’s high and low.
D/D: Following yesterday’s inside day, $ES_F had an outside down day. It also remains in the balance area of the past 11 sessions.
E-mini S&P 500 Metrics
Recent Performance & Technicals
E-mini S&P 500 Volume/Market Profile
ES Composite Volume Profile (5 days)
📈 Here is a chart of the past five sessions with a composite ETH Volume Profile:
ES ETH/RTH Split Volume Profile (5 days)
📈 Here is a chart of the past five sessions with a daily ETH/RTH split Volume Profile:
ES ETH/RTH Split Market/Volume Profile (today)
📈 Here’s a TPO chart of today’s session with ETH/RTH split Market/Volume Profile:
ES Market/Volume Profile Levels
RTH Weak High/Low: 4095 (low); 4145.50 (high)
RTH Single Prints: n/a
RTH Excess: n/a
RTH Gap: n/a
Session Recap
Electronic Trading Hours (ETH)
Overnight Session:
Wholesale was long at the prior day’s close. The overnight open was inside of the prior day’s price range but above the value area. Inventory during the overnight session was long to begin the session. Shorts couldn’t take $ES_F below 4155.75. It traded sideways above the previous day’s close for the next couple of TPO periods, hitting a weak high at 4168.50. $ES_F got short after the London session opened and fell into the prior day’s value area going into the PPI release. When the PPI number came in hotter than expected, the auction slid 40-handles to get beneath the prior day’s low and make new session lows at 4101.50. Overnight VPOC was 4111.25.
Regular Trading Hours (RTH) Session:
RTH gapped down and opened below the prior day’s low and right at the T+2 low. In the opening hour, supply couldn’t send the auction below 4098.25 as a strong bid was present. Buyers then lifted $ES_F back inside the T+2 and prior day’s range. During the IB period, buyers just missed bring the action back into the prior day’s value area. The market continued to move up and got to 3.50 points of the prior day’s value area high before hitting trapped long supply. $ES_F traded sideways and put in a weak high at 4145.50. In L-period, supply aggressively hit the bid and caused the market to slide 30-handles. In the final 3-TPO periods of ETH, the auction continued to fall another 15-handles to get well below the prior day’s low and T+2 low. Overall, it was a back and forth session with all the price action remaining inside the larger balance area of the past 11 trading days.


