
02/15/2023 Synopsis
Stocks shook off early losses and ticked higher as bonds fell.

Market Overview
Equity indices ticked higher. The Nasdaq led and the Dow lagged. Nine S&P sectors were positive. Consumer discretionary was the best performing sector again while energy was the worst.
US Treasury yields were up and down with the longer end of the curve rising. The 2-year yield was up 1.5 bps to 4.63%. The 10-year yield gained 6.2 bps to 3.81%. Below is a chart with a comparison of the yield on several Treasuries of varying duration.

$DXY is stuck in a range but rose 0.52% to the top of that range today. It closed at 103.81.
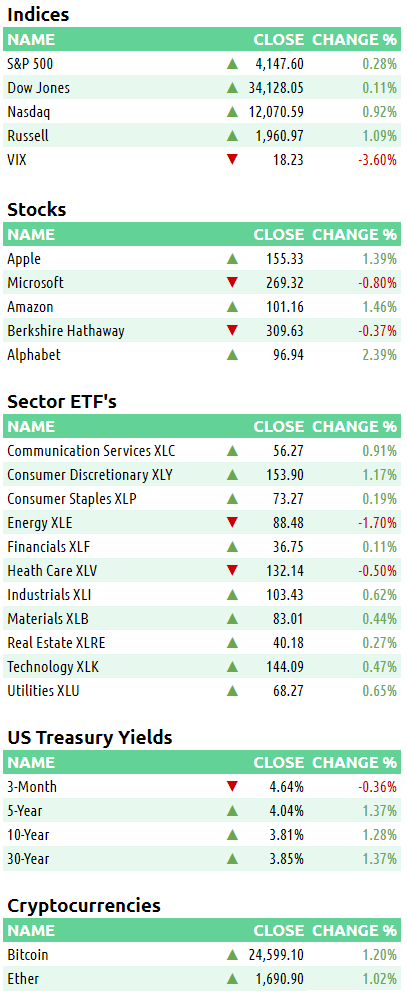
Here are some of today’s closing prices.
E-mini S&P 500 Top-Down Analysis
📈 Below are the monthly, weekly, daily and 4-hour charts for $ES_F.

M/M: January was an inside month as all price action was contained inside December’s high and low. The past 3-months have been in balance.
W/W: $ES_F just had an inside week with all price action inside the prior week’s high and low.
D/D: For the third straight day, $ES_F traded above the prior day’s low and is OTFU. The past 10 sessions have remained in a 150-point range from 4060.75 to 4208.50. Today was also an inside day with all price action remaining inside the prior day’s high and low.
E-mini S&P 500 Metrics
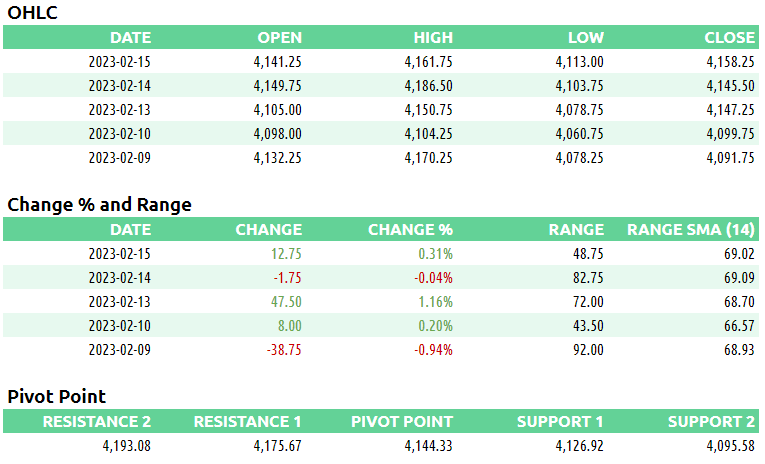
Recent Performance & Technicals

E-mini S&P 500 Volume/Market Profile
ES ETH/RTH Split Volume Profile (5 days)
📈 Here is a chart of the past five sessions with a daily ETH/RTH split Volume Profile:

ES ETH/RTH Split Market/Volume Profile (today)
📈 Here’s a TPO chart of today’s session with ETH/RTH split Market/Volume Profile:

ES Market/Volume Profile Levels

RTH Weak High/Low: n/a
RTH Single Prints: 4154 to 4157
RTH Excess: 4113 to 4115.50; 4161 to 4161.75
RTH Gap: n/a
Session Recap
Electronic Trading Hours (ETH)
Overnight Session:
Wholesale was short at the prior day’s close. The overnight open was inside of the prior day’s value area, 3.75 points from VPOC. Inventory during the overnight session was entirely short. Trapped long supply prevented any trades above 4142.25. Supply slowly pushed the auction down towards the bottom and momentarily under the previous day’s value area. After supply ran out at 4120, $ES_F rotated and corrected to the upside. When retail and manufacturing data was released at 8:30am EST, there was an increase in volatility that saw a spike down to 4116 before correcting upwards. Overnight VPOC was 4127.50 and all of the price action was inside the prior day’s IB range.
Regular Trading Hours (RTH) Session:
RTH opened a few ticks below the prior day’s value area but was inside the range and T+2 range. The opening hour was rotational inside a 20-handle range. Supply couldn’t move the bid below 4113, one tick beneath the prior day’s IB low. Buyers then lifted the offer near the top of the range of the IB period. After the opening hour, buyers continued to absorb any selling and were eventually able to lift $ES_F above the IB range and overnight range. At 4146.50 and 4154, there was supply and wholesale backfilled until it found the bid. Buyers then chewed up supply which led to some more gains in $ES_F. The auction got above the prior day’s high but longs couldn’t lift the offer above 4161.75.