
02/14/2023 Synopsis
Stocks were mixed as inflation rose 0.5% M/M and 6.4% Y/Y.

Market Overview

With the exception of the Nasdaq, every equity index was down with the Dow falling the most as inflation rose in January. Five S&P sectors were positive. Consumer discretionary led while the real estate lagged.
Most US Treasury yields were up. The yield on the 2-year note ascended 9.6 bps to 4.62%. The yield on the 10-year note climbed 4.2 bps to 3.74%. Below is a chart with a comparison of the yield on several Treasuries of varying duration.

The US Dollar index $DXY lost 0.03% to fall to 103.26.
Here are some of today’s closing prices.

E-mini S&P 500 Top-Down Analysis

📈 Below are the monthly, weekly, daily and 4-hour charts for $ES_F.

M/M: January was an inside month as all price action was contained inside December’s high and low. The past 3-months have been in balance.
W/W: $ES_F just had an inside week with all price action inside the prior week’s high and low.
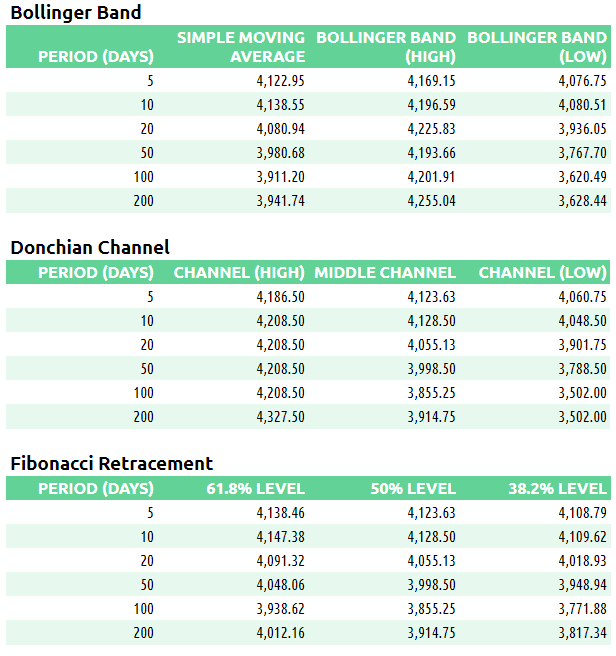
D/D: For the second straight day, $ES_F traded above the prior day’s low and is OTFU. The past 9 sessions have remained in a 150-point range from 4060.75 to 4208.50.
E-mini S&P 500 Metrics
Recent Performance & Technicals

E-mini S&P 500 Volume/Market Profile
ES Composite Volume Profile (5 days)
📈 Here is a chart of the past five sessions with a composite ETH Volume Profile:

ES ETH/RTH Split Volume Profile (5 days)
📈 Here is a chart of the past five sessions with a daily ETH/RTH split Volume Profile:

ES ETH/RTH Split Market/Volume Profile (today)
📈 Here’s a TPO chart of today’s session with ETH/RTH split Market/Volume Profile:

ES Market/Volume Profile Levels

RTH Weak High/Low: n/a
RTH Single Prints: n/a
RTH Excess: 4103.75 to 4111.75; 4156.75 to 4170
RTH Gap: n/a
Session Recap
Electronic Trading Hours (ETH)
Overnight Session:
Wholesale was long at the prior day’s close. The overnight open was inside of the prior day’s range and right at the VAH. Inventory during the overnight session was short initially. After failing to trade underneath 4132, buyers in the London session lifted the auction higher. $ES_F inventory got long and surpassed the prior day’s high. When the CPI figure for January was released, $ES_F ping ponged violently in a 50-point range from 4132 to 4186.50, both new extreme highs and lows for the overnight session. Supply continued to push the market lower as 4130.25 was hit just before RTH, a new overnight low. Overnight VPOC was 4145.25.
Regular Trading Hours (RTH) Session:
RTH opened up in the prior day’s range and one tick below the VAL. The open was also above the T+2 high. The IB range was 55-points wide. After the opening bell, the selloff continued below the overnight low but buyers stepped in at 4114. From there, $ES_F climbed back into the overnight range and above the prior day’s high before hitting supply at 4170. Supply then pushed the auction back down 65-handles and beneath the IB low. Wholesale found the bid at 4103.75, which was 2.25 points from the prior day’s low. The auction rotated back up into the IB range and overnight range. For the remainder of the day, $ES_F consolidated in a 25-point range from 4131.25 to 4156.25.