
02/09/2023 Synopsis
Stocks, bonds and the dollar had a meltdown as yields rose.

Market Overview

Stocks and bonds sold off today. Every index was down with the Russell and Nasdaq melting down the most. Every S&P 500 sector bled. Communications lagged while consumer discretionary led.
US Treasury yields all rose today. The 2-year could be breaking out of a recent balance area with a gain of 6.1 bps to 4.49%. The 10-year yield could be in line for a similar breakout after climbing 5.1 bps to 3.66%. A continued rise for either could put additional pressure on stocks. Below is a chart with a comparison of the yield on several Treasuries of varying duration.

The US Dollar index $DXY is in a consolidation following a recent breakout. It fell 0.27% to 103.18.

Crude oil futures broke their recent win streak by falling to 78.06, a 0.52% loss.
Here are some of today’s closing prices.

E-mini S&P 500 Top-Down Analysis

📈 Below are the monthly, weekly, daily and 4-hour charts for $ES_F.

M/M: January was an inside month as all price action was contained inside December’s high and low. The past 3-months have been in balance.
W/W: For the sixth straight week, $ES_F traded above the prior week’s low and is OTFU. $ES_F momentarily rose above the 23.6% Fib level but could not close above it.
D/D: $ES_F crumbled and is now OTFD. The auction also fell beneath the recent swing low at 4098.25 and settled underneath it.
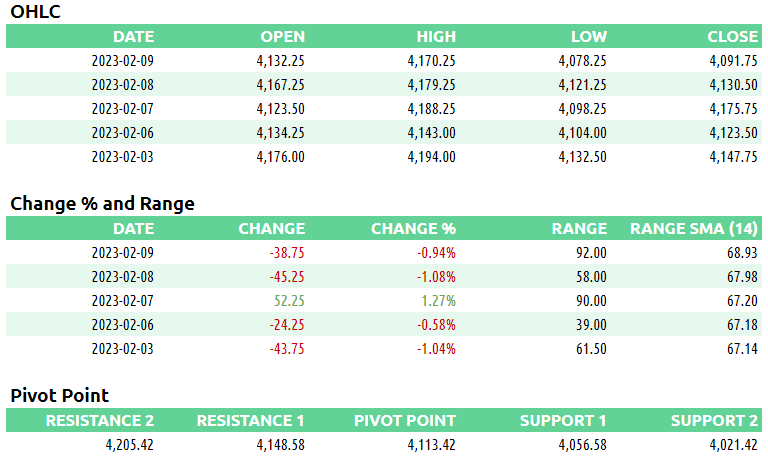
E-mini S&P 500 Metrics
Recent Performance & Technicals

E-mini S&P 500 Volume/Market Profile
ES Composite Volume Profile (5 days)
📈 Here is a chart of the past five sessions with a composite ETH Volume Profile:

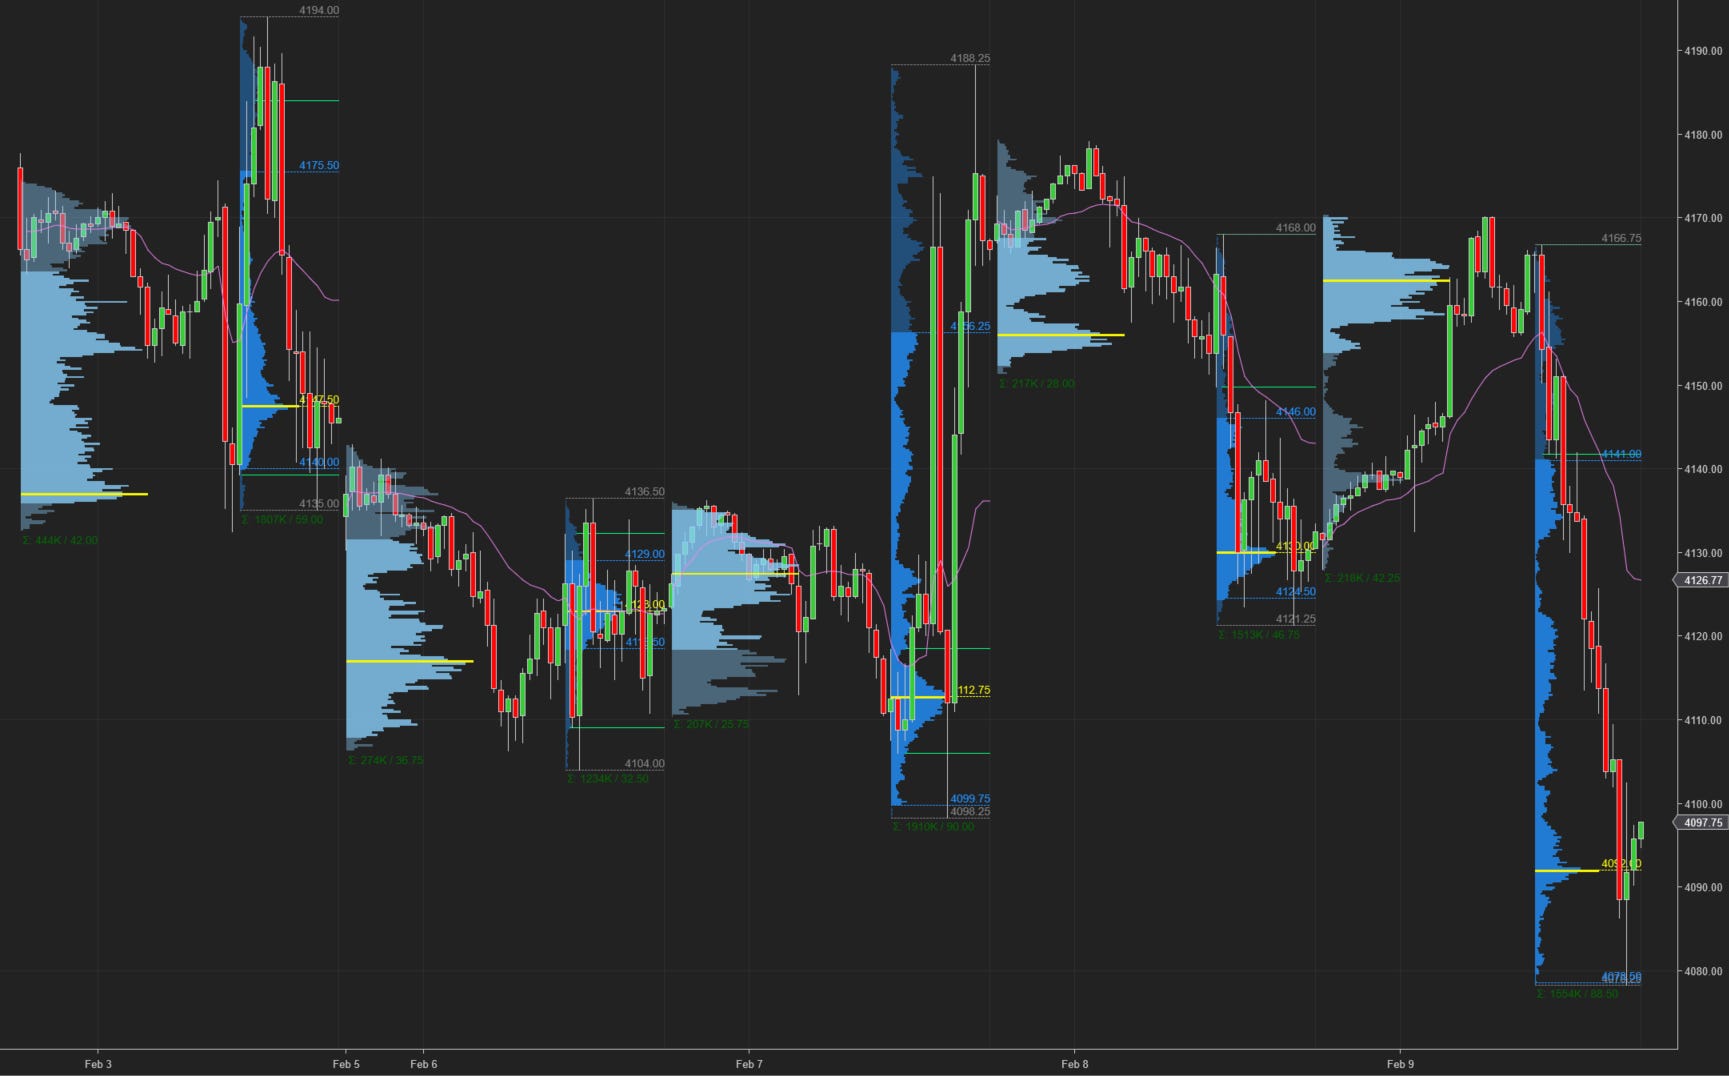
ES ETH/RTH Split Volume Profile (5 days)
📈 Here is a chart of the past five sessions with a daily ETH/RTH split Volume Profile:
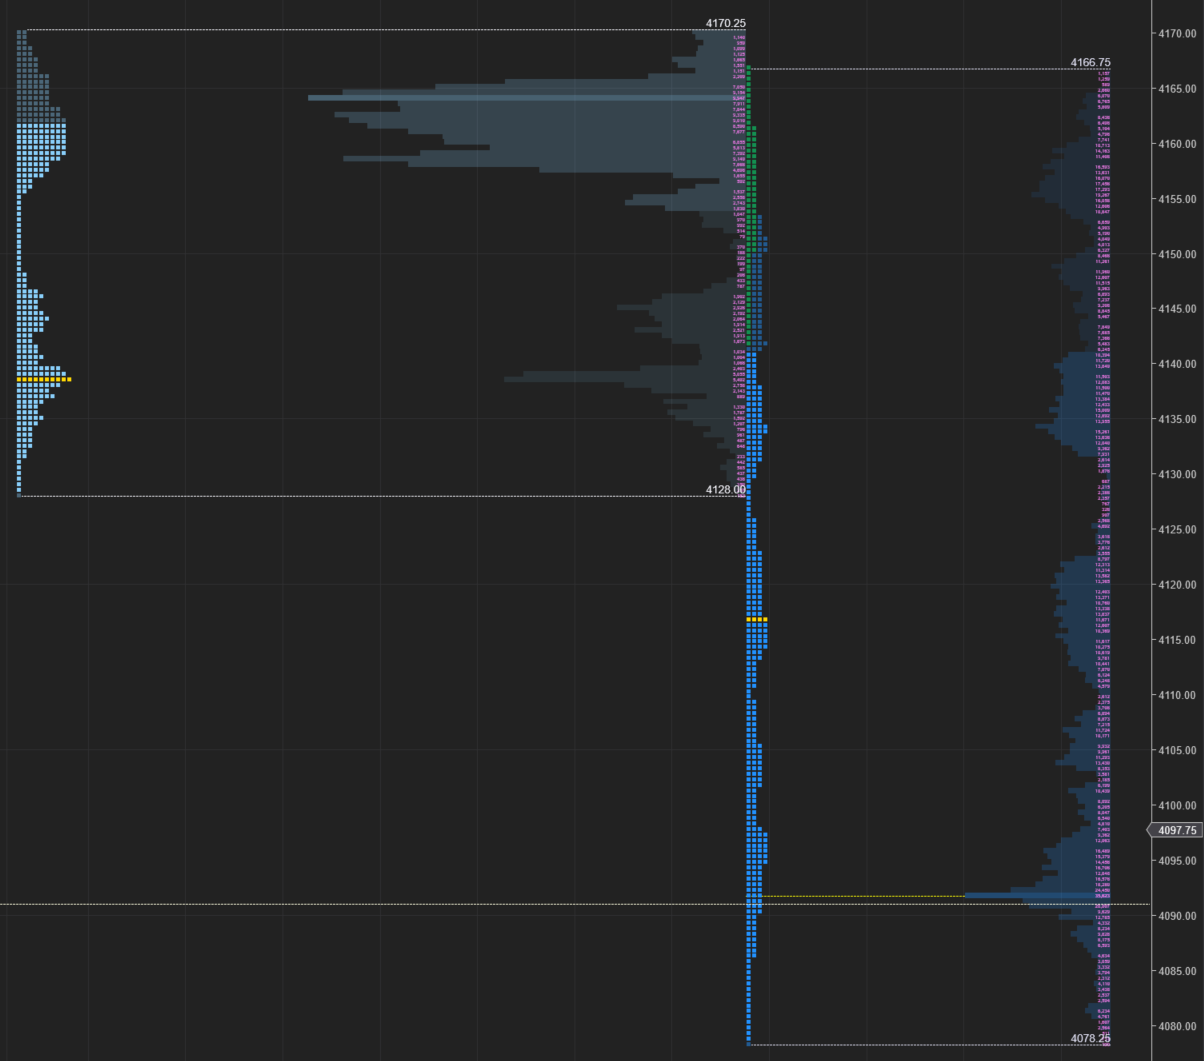
ES ETH/RTH Split Market/Volume Profile (today)
📈 Here’s a TPO chart of today’s session with ETH/RTH split Market/Volume Profile:
ES Market/Volume Profile Levels

RTH Weak High/Low: n/a
RTH Single Prints: 4109.5 to 4110.75; 4125.75 to 4130;
RTH Excess: 4078.25 to 4086.25; 4161.25 to 4166.75
RTH Gap: n/a
Session Recap
Electronic Trading Hours (ETH)
Overnight Session:
Wholesale was short at the prior day’s close. The overnight open was inside the prior day’s value area. There was very little selling pressure in the overnight session as inventory was completely long. At the Asian open, $ES_F found a bid at 4128 and price action turned to the upside afterwards. There was strong demand at the London open which pushed $ES_F above the prior day’s value area. This trapped short traders with a set of single prints on the way up from 4148 to 4155.75. The auction kept climbing and eventually took out the prior day’s high before halting at 4170.25 with a double top. Supply was met and wholesalers backfilled in search of buyers. Overnight VPOC was 4158.50, near the top of the price range.
Regular Trading Hours (RTH) Session:
The RTH open was several points inside the prior day’s high and inside the T+2 high/low. The opening hour was all supply. The auction barely rose above the US opening price and any rallies during the IB were absorbed by sellers. During C-period, responsive buyers took the auction back towards ETH VWAP but this rally was again absorbed by supply. From this point on, $ES_F melted down. For the remainder of the day, the market dropped 75-points and took out key levels along the way. The prior day and T+2 lows were erased. In addition, the collapse ripped through the 38.2 down to the 61.8 retracement levels for the past 15-periods. Supply finally ran out at 4078.25 where short covering stabilized the auction.