
02/02/2023 Synopsis
The Nasdaq led all indices but Apple, Amazon and Alphabet disappoint in after-hour earnings.

Market Overview
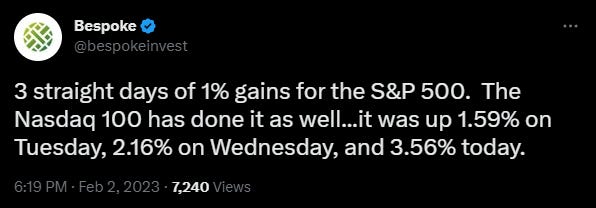
The Nasdaq had its best day since November. The Russell 2000 and the S&P 500 were also positive while the Dow Jones fell 39-points. Seven S&P sectors were up. Communications led and energy lagged. The S&P 500 has now reached a key Fibonacci level (pandemic low to 2022 high) as it has been moving higher since bouncing off the 50% retracement level in October.

US Treasury yields continued their slide.
2-year: 4.10%, down 0.7 bps
10-year: 3.39%, down 2.5 bps

The US Dollar index $DXY opened up at a 7-month low. However, it climbed 0.56% to 107.74.
Crude oil continued its slide as it fell 0.69% down to 75.88.


Here are some of today’s closing prices.

E-mini S&P 500 Top-Down Analysis

📈 Below are the monthly, weekly, daily and 4-hour charts for $ES_F.

M/M: January was an inside month as all price action was contained inside December’s high and low. The past 3-months have been in balance.
W/W: For the fifth straight week, $ES_F traded above the prior week’s low and is OTFU.
D/D: $ES_F continued its climb and closed above the 4175-4180 area. It also closed above the 23.6% Fib level (Pandemic low to 2022 high) and continues to OTFU.
E-mini S&P 500 Metrics
Recent Performance & Technicals


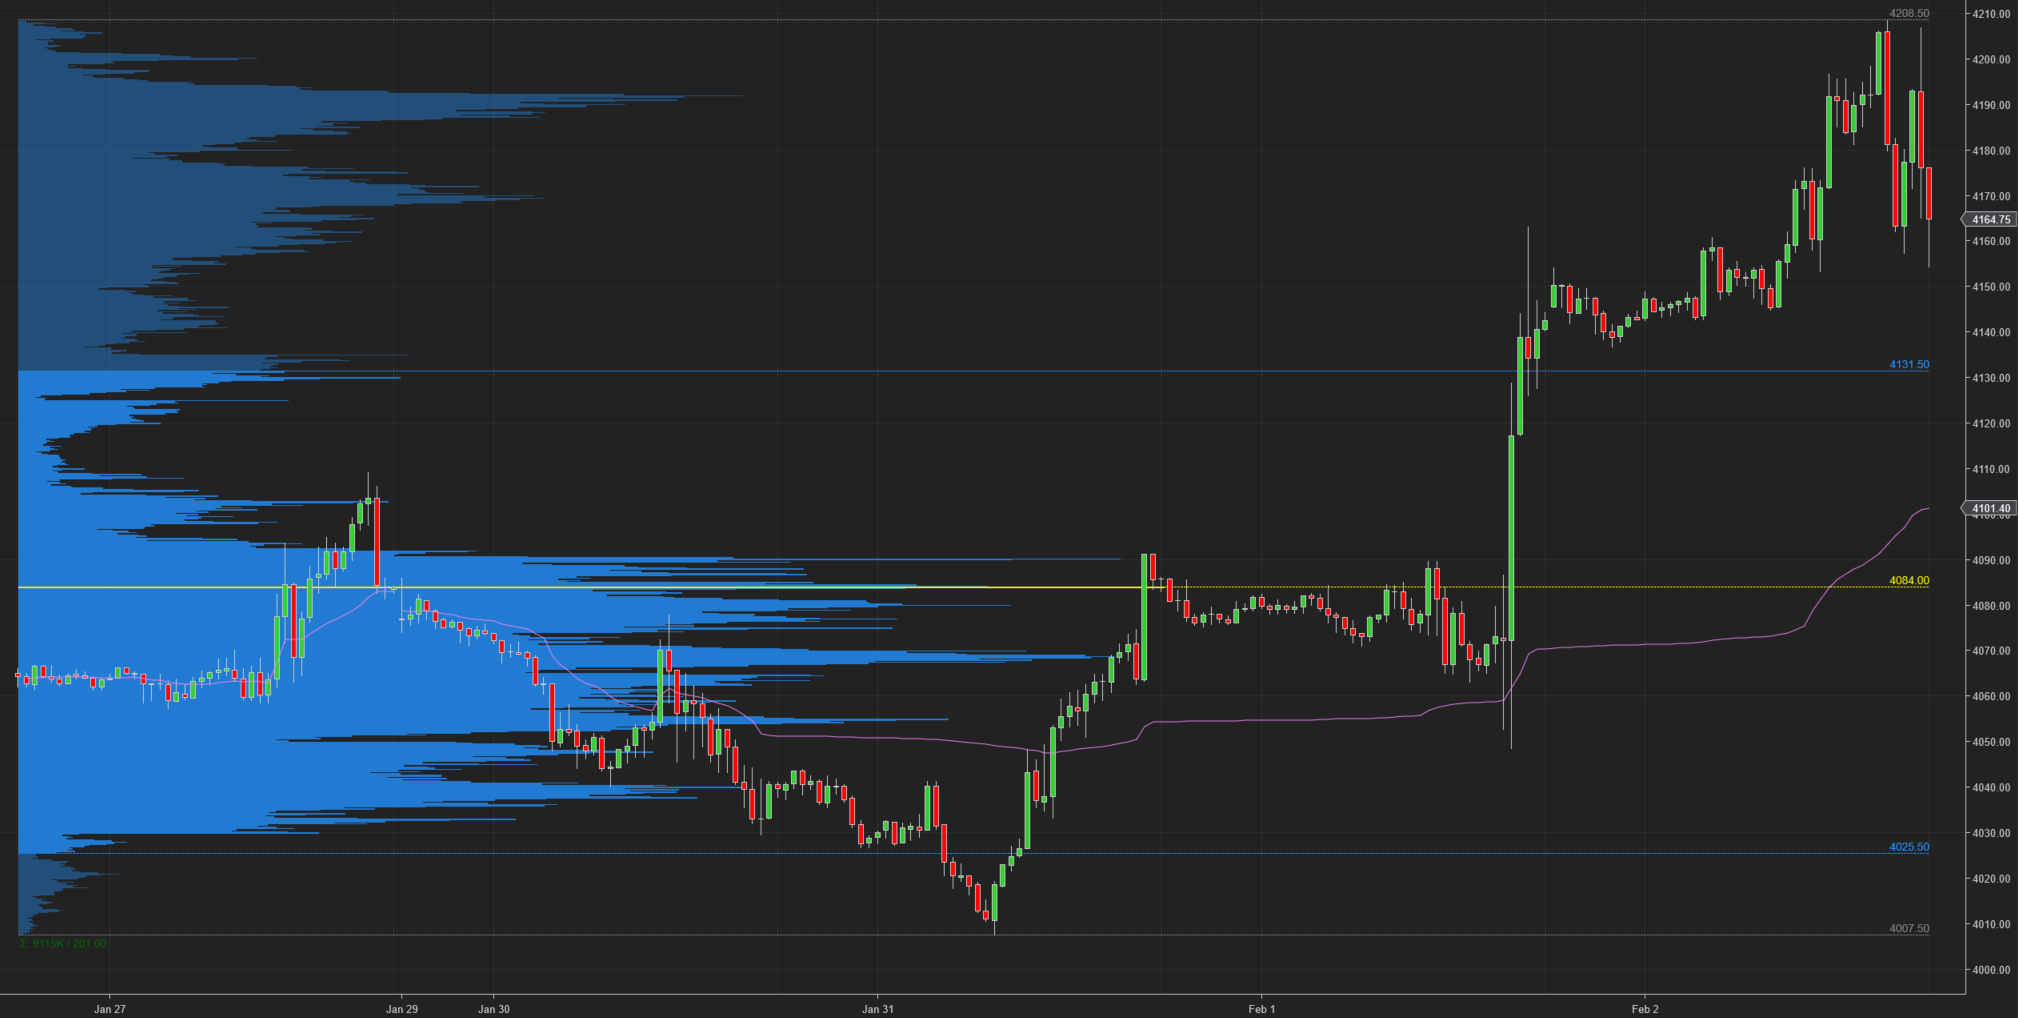
E-mini S&P 500 Volume/Market Profile
ES Composite Volume Profile (5 days)
📈 Here is a chart of the past five sessions with a composite ETH Volume Profile:
ES ETH/RTH Split Volume Profile (5 days)
📈 Here is a chart of the past five sessions with a daily ETH/RTH split Volume Profile:

ES ETH/RTH Split Market/Volume Profile (today)
📈 Here’s a TPO chart of today’s session with ETH/RTH split Market/Volume Profile:

ES Market/Volume Profile Levels

RTH Weak High/Low: n/a
RTH Single Prints: n/a
RTH Excess: 4153.25 to 4154.25; 4207 to 4208.50
RTH Gap: n/a
Session Recap
Electronic Trading Hours (ETH)
Overnight Session:
Wholesale was long at the prior day’s close. The overnight open was above the prior day’s value area but inside of the HOD. Inventory was mostly long during the overnight session. Sellers couldn’t bring the bid beneath 4136.75 as trapped shorts held up the auction. Going into RTH, $ES_F took out the prior day’s high before hitting a seller at 4176.25. Overnight VPOC was 4147.75.
Regular Trading Hours (RTH) Session:
RTH opened up on a gap up as it was above the prior day’s high and T+2 high. The US open was volatile with a seller at 4176. $ES_F fell and closed the gap. However, trapped shorts and buyers were able to absorb supply as the auction failed to trade underneath 4153.25. This resulted in buyers lifting $ES_F up towards the 4200 area where it stalled for awhile. In I-period, buyers finally broke out of the 4200 level but found more supply at 4208.50. Buyers disappeared as sellers pushed the auction back down to the IB range, a 50-point drop. Sellers were unable to push price beneath the IB low, as there was a strong bid at 4157.25. Short covering stabilized the auction and led to a 35-point rally to end RTH. However, things got wild in the after-hours with AAPL 0.00%↑, AMZN 0.00%↑, and GOOGL 0.00%↑ reporting. The companies all disappointed and $ES_F collapsed back down to the IB range and came within a point of the low for the session before supply fizzled.