
01/31/2023 Synopsis
Equities rally as the S&P 500, +6.18% for the month, posted its best January since 2019.

Market Overview

Every major index was positive with small-caps and the Russell 2000 climbing nearly 2.5%. The Dow, +1.09%, trailed its counterparts. Every S&P 500 sector ticked higher. Consumer discretionary led while utilities lagged.
The yields on short-duration US Treasury bills were mixed while T-note and bond rates dropped. The yield on the 2-year fell 3.5 bps to 4.2%. The 10-year yield lost 3 bps to 3.5%. Below is a chart with a comparison of the yield on several Treasuries of varying duration.

The US Dollar index $DXY gave up 0.15% to fall to 102.08.
Crude oil recovered its early losses and ended the day up 1.25% and closed at 78.87.
With tomorrow concluding FOMC, the expectation is that the Fed will raise rates 25 bps. CME’s FedWatch tool gives this scenario a 99.4% probability.

Source: CME Below are all the rate hikes from 2022 along with the S&P’s reaction.

Here are some of today’s closing prices.


E-mini S&P 500 Top-Down Analysis

📈 Below are the monthly, weekly, daily and 4-hour charts for $ES_F.
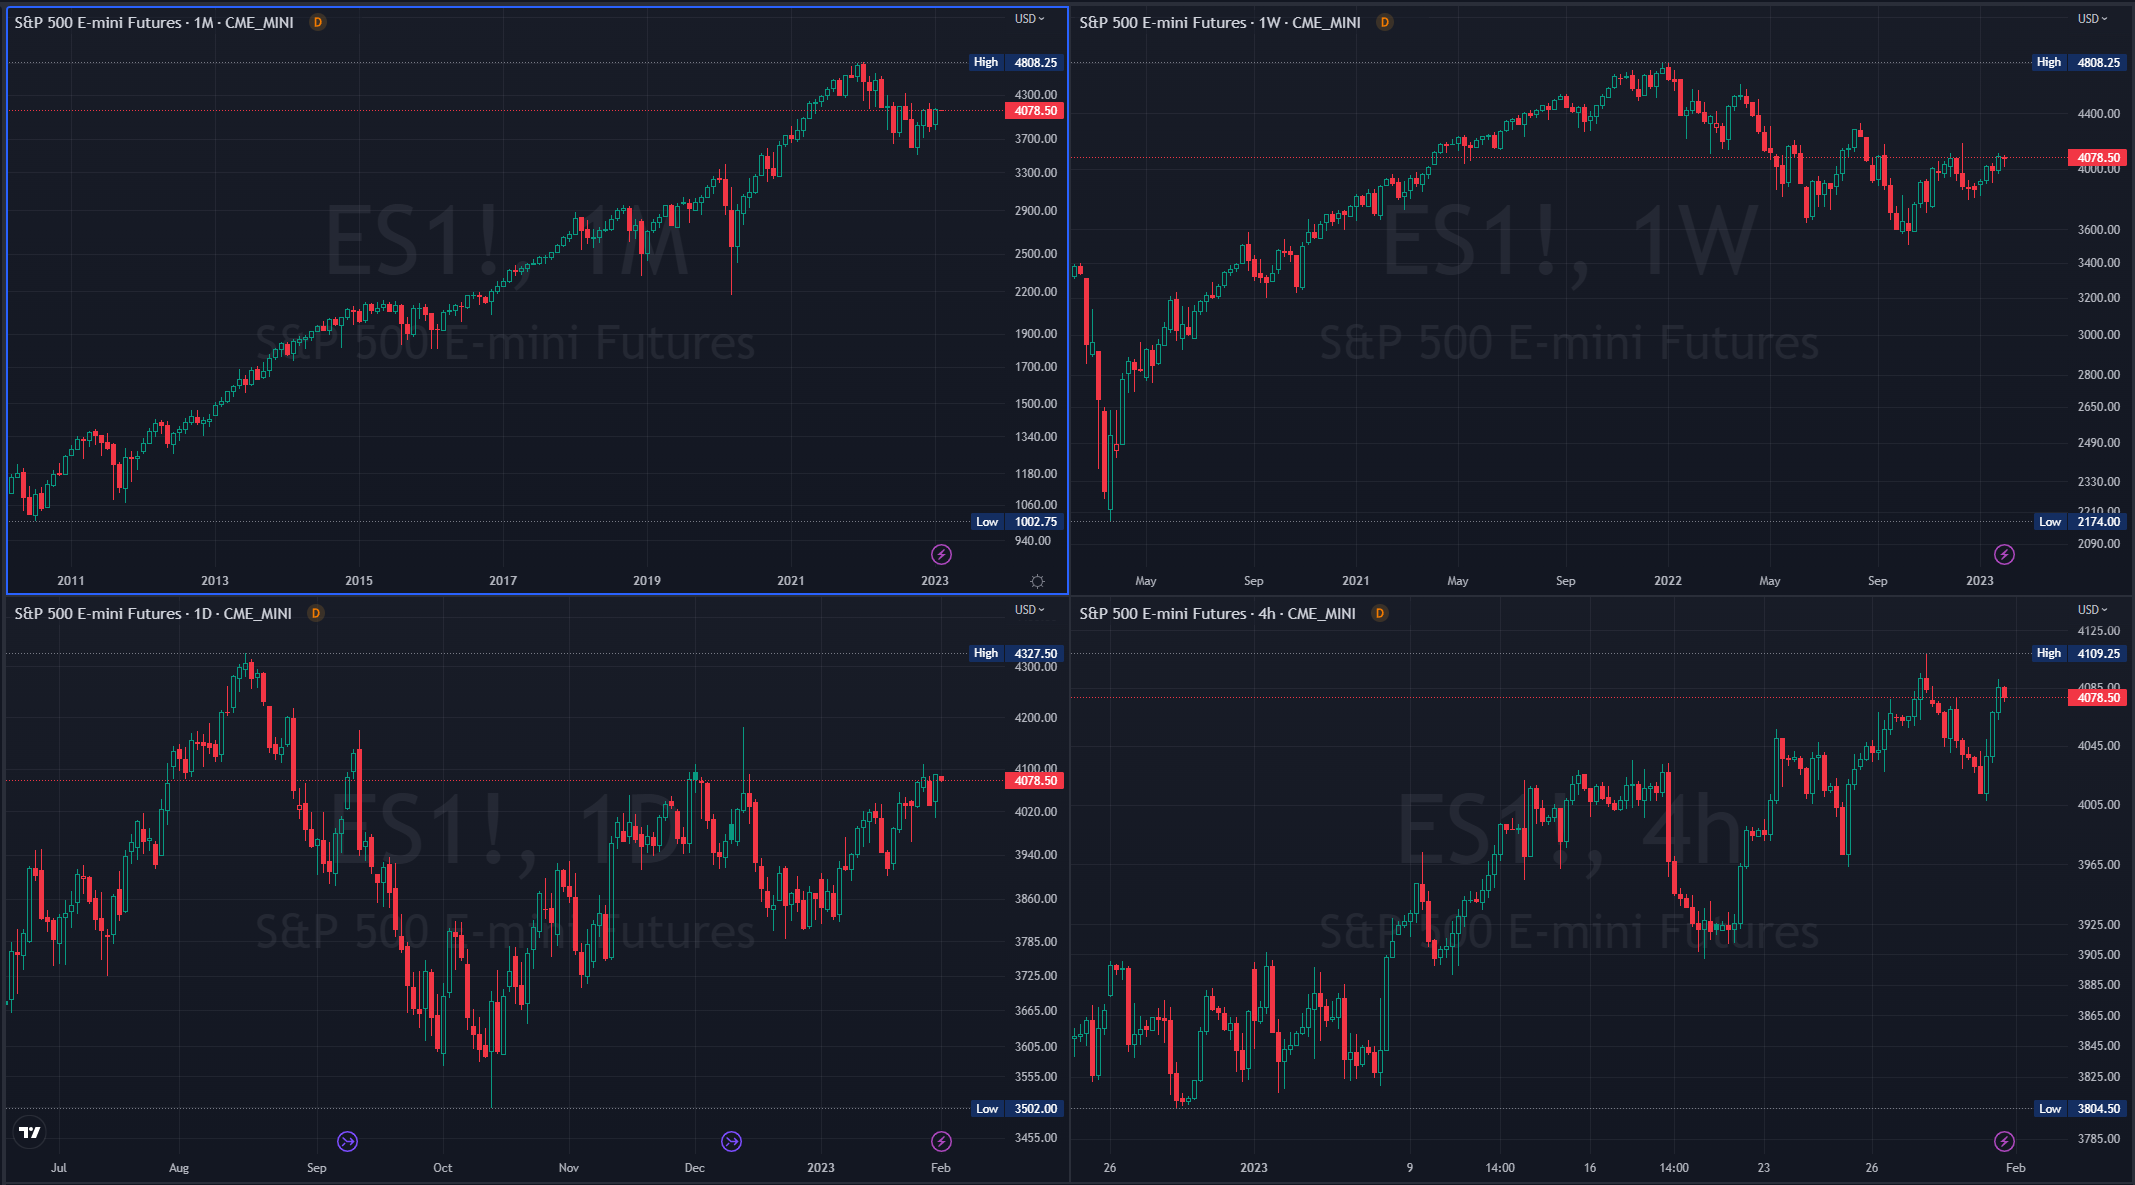
M/M: Despite falling in December, $ES is still OTFU after failing to erase November’s low. $ES failed and close beneath the 10-month MA.
W/W: For the fifth straight week, $ES_F traded above the prior week’s low and is OTFU.
D/D: $ES_F had an outside, up day where all price action exceeded the prior day’s range, while closing above the prior day’s high.
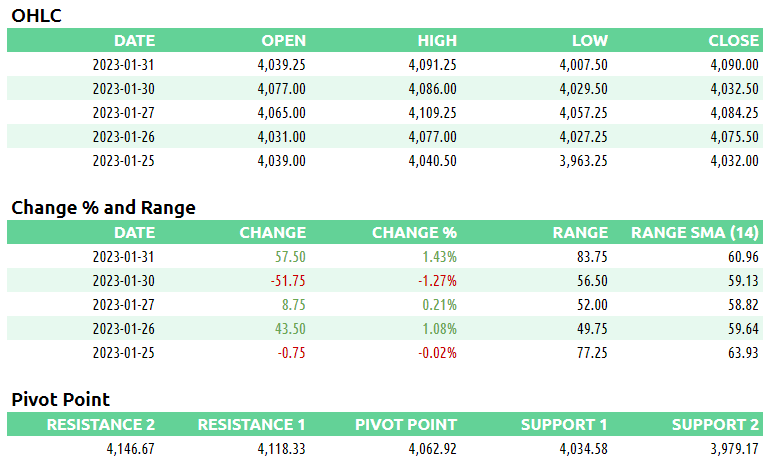
E-mini S&P 500 Metrics
Recent Performance & Technicals

E-mini S&P 500 Volume/Market Profile
ES Composite Volume Profile (5 days)
📈 Here is a chart of the past five sessions with a composite ETH Volume Profile:

ES ETH/RTH Split Volume Profile (5 days)
📈 Here is a chart of the past five sessions with a daily ETH/RTH split Volume Profile:
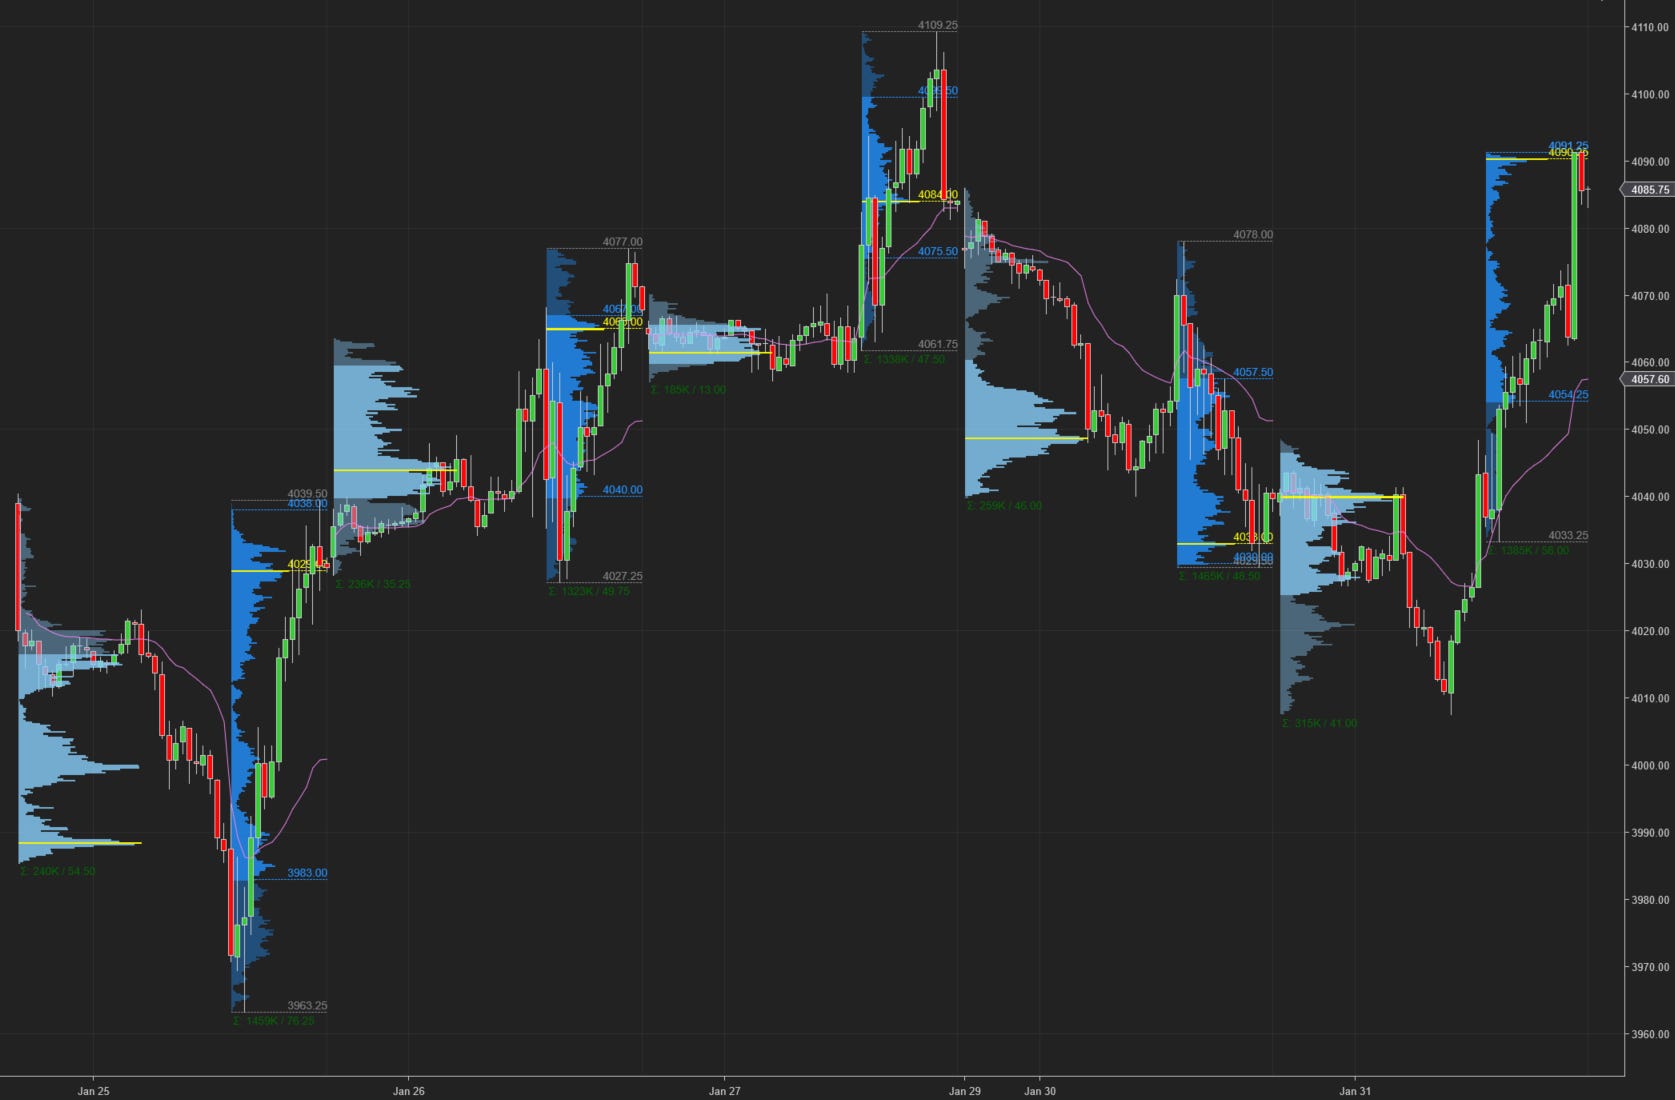
ES ETH/RTH Split Market/Volume Profile (today)
📈 Here’s a TPO chart of today’s session with ETH/RTH split Market/Volume Profile:

ES Market/Volume Profile Levels
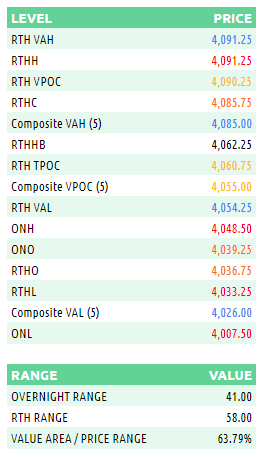
RTH Weak High/Low: 4091.25 (high)
RTH Single Prints: 4049.5 to 4050.25; 4074.75 to 4083
RTH Excess: 4033.25 to 4034.75
RTH Gap: n/a
Session Recap
Electronic Trading Hours (ETH)
Overnight Session:
Wholesale was short at the prior day's close. The overnight open was inside of the prior day's value area. Inventory during the overnight session was mostly short. There was supply at 4044 and buyers couldn't lift the offer above this level early on during the Japan open. Supply moved the auction 20-handles lower. Prior to the London open, inventory corrected but then sold off once London opened up. There was a bid at 4007.50 where supply shut off and shorts covered. This resulted in a 40-point rally going into RTH. VPOC in the overnight session was 4040.25.
Regular Trading Hours (RTH) Session:
The RTH open was inside of the prior day's value area and below the T+2 low. There was a responsive seller at 4050 that took the auction down during the IB period. There was a lack of follow through on the seller’s part to take the bid beneath 4033.25. Buyers lifted the offer and $ES_F rotated up with the supply gone. In C-period, the auction climbed above the IB trading range and trended higher all day for the remainder of the day. The rally stalled at 4091.25 with a weak high, a sign of trapped long supply in this area.