
01/27/2023 Synopsis

Market Overview

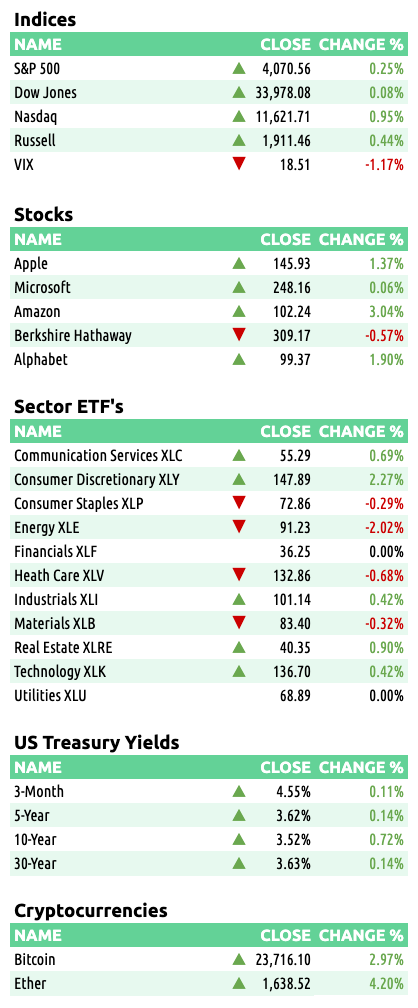
Equity indexes were all positive Friday with the Nasdaq ending the week the strongest. Five S&P sectors were green. Consumer discretionary led and energy lagged.
US Treasury yields were all up. The 2-year yield gained 2 bps to 4.2%. The 10-year was up 0.3 bps to 3.505%. Below is the yield curve for the 3-month, 2-year, 10-year and 30-year yields.

The US Dollar index $DXY gained 0.1% to finish at 101.92.
Crude oil lost 1.64% to end the week at 79.68.
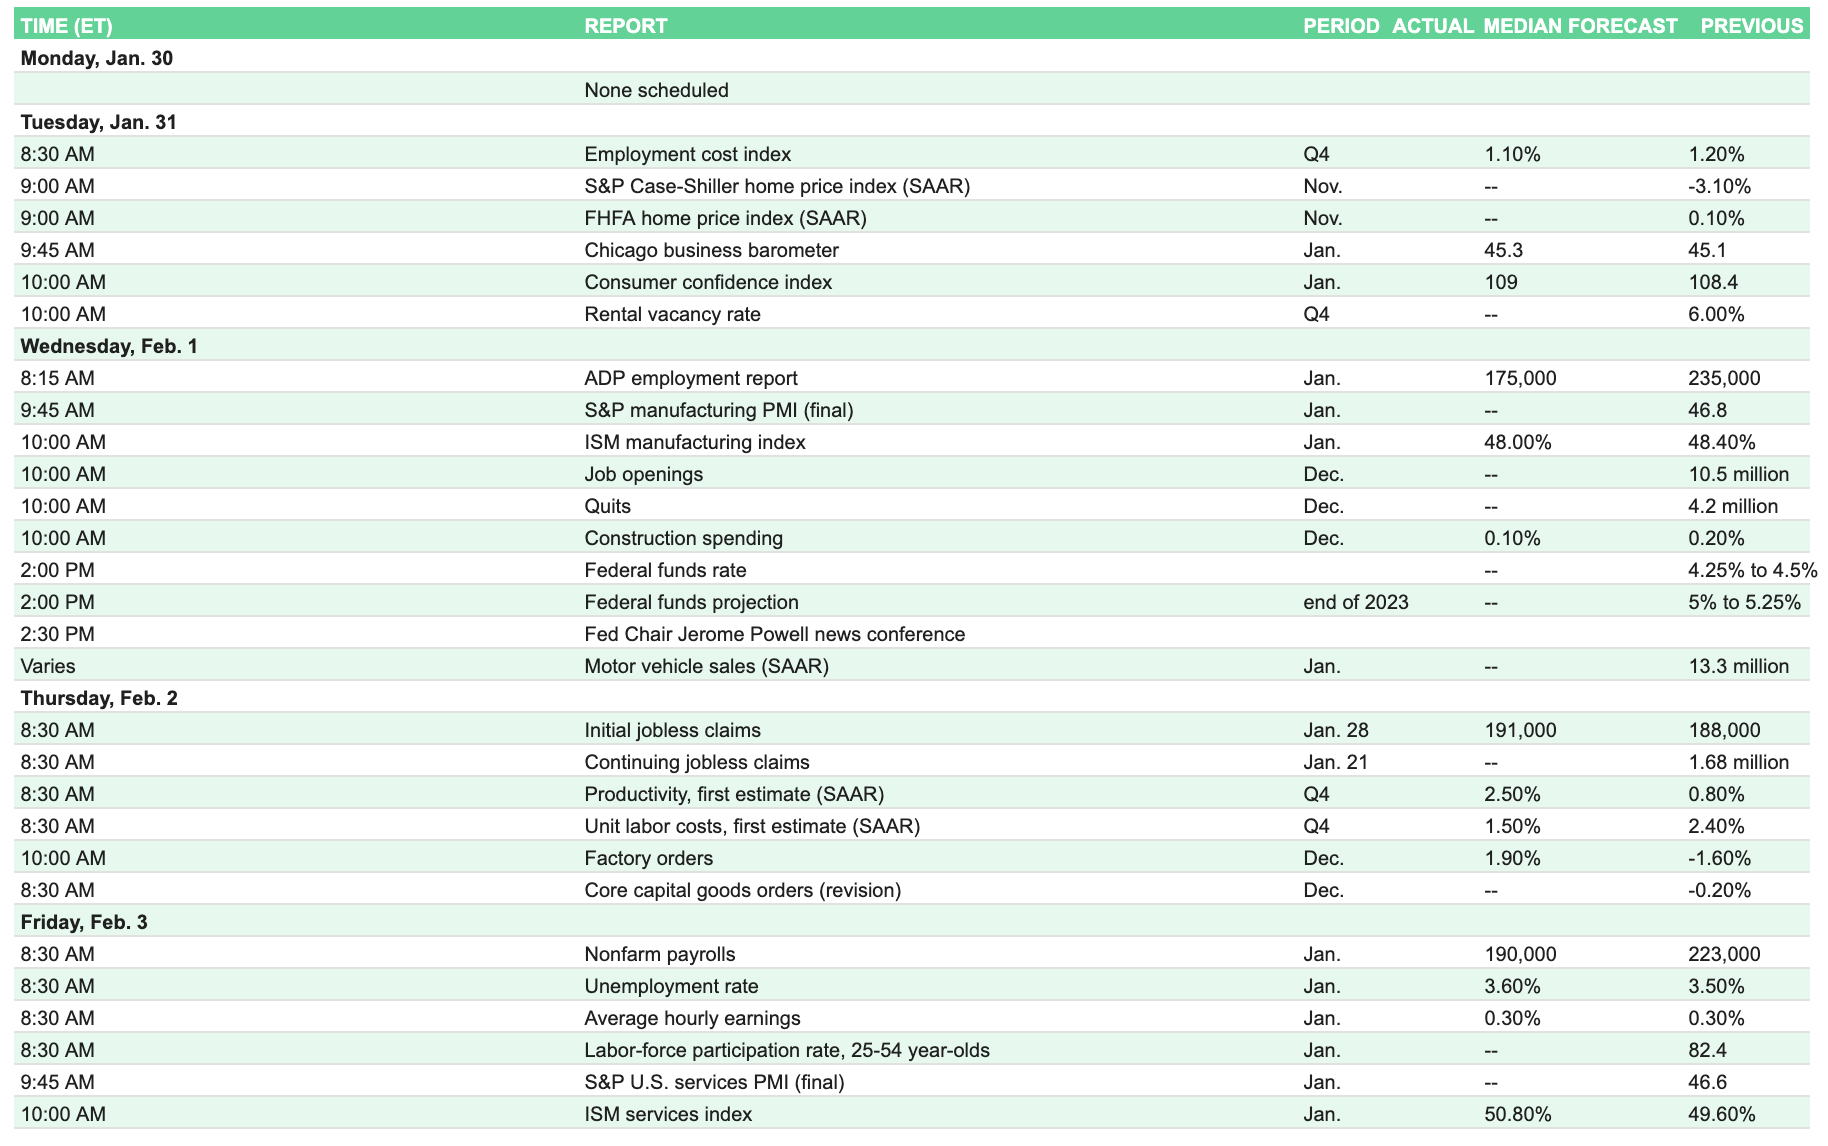
Events this week:
Here are some of Friday’s closing prices.
E-mini S&P 500 Top-Down Analysis

📈 Below are the monthly (5-years), weekly (2-years) and daily (6-months) charts for ES.
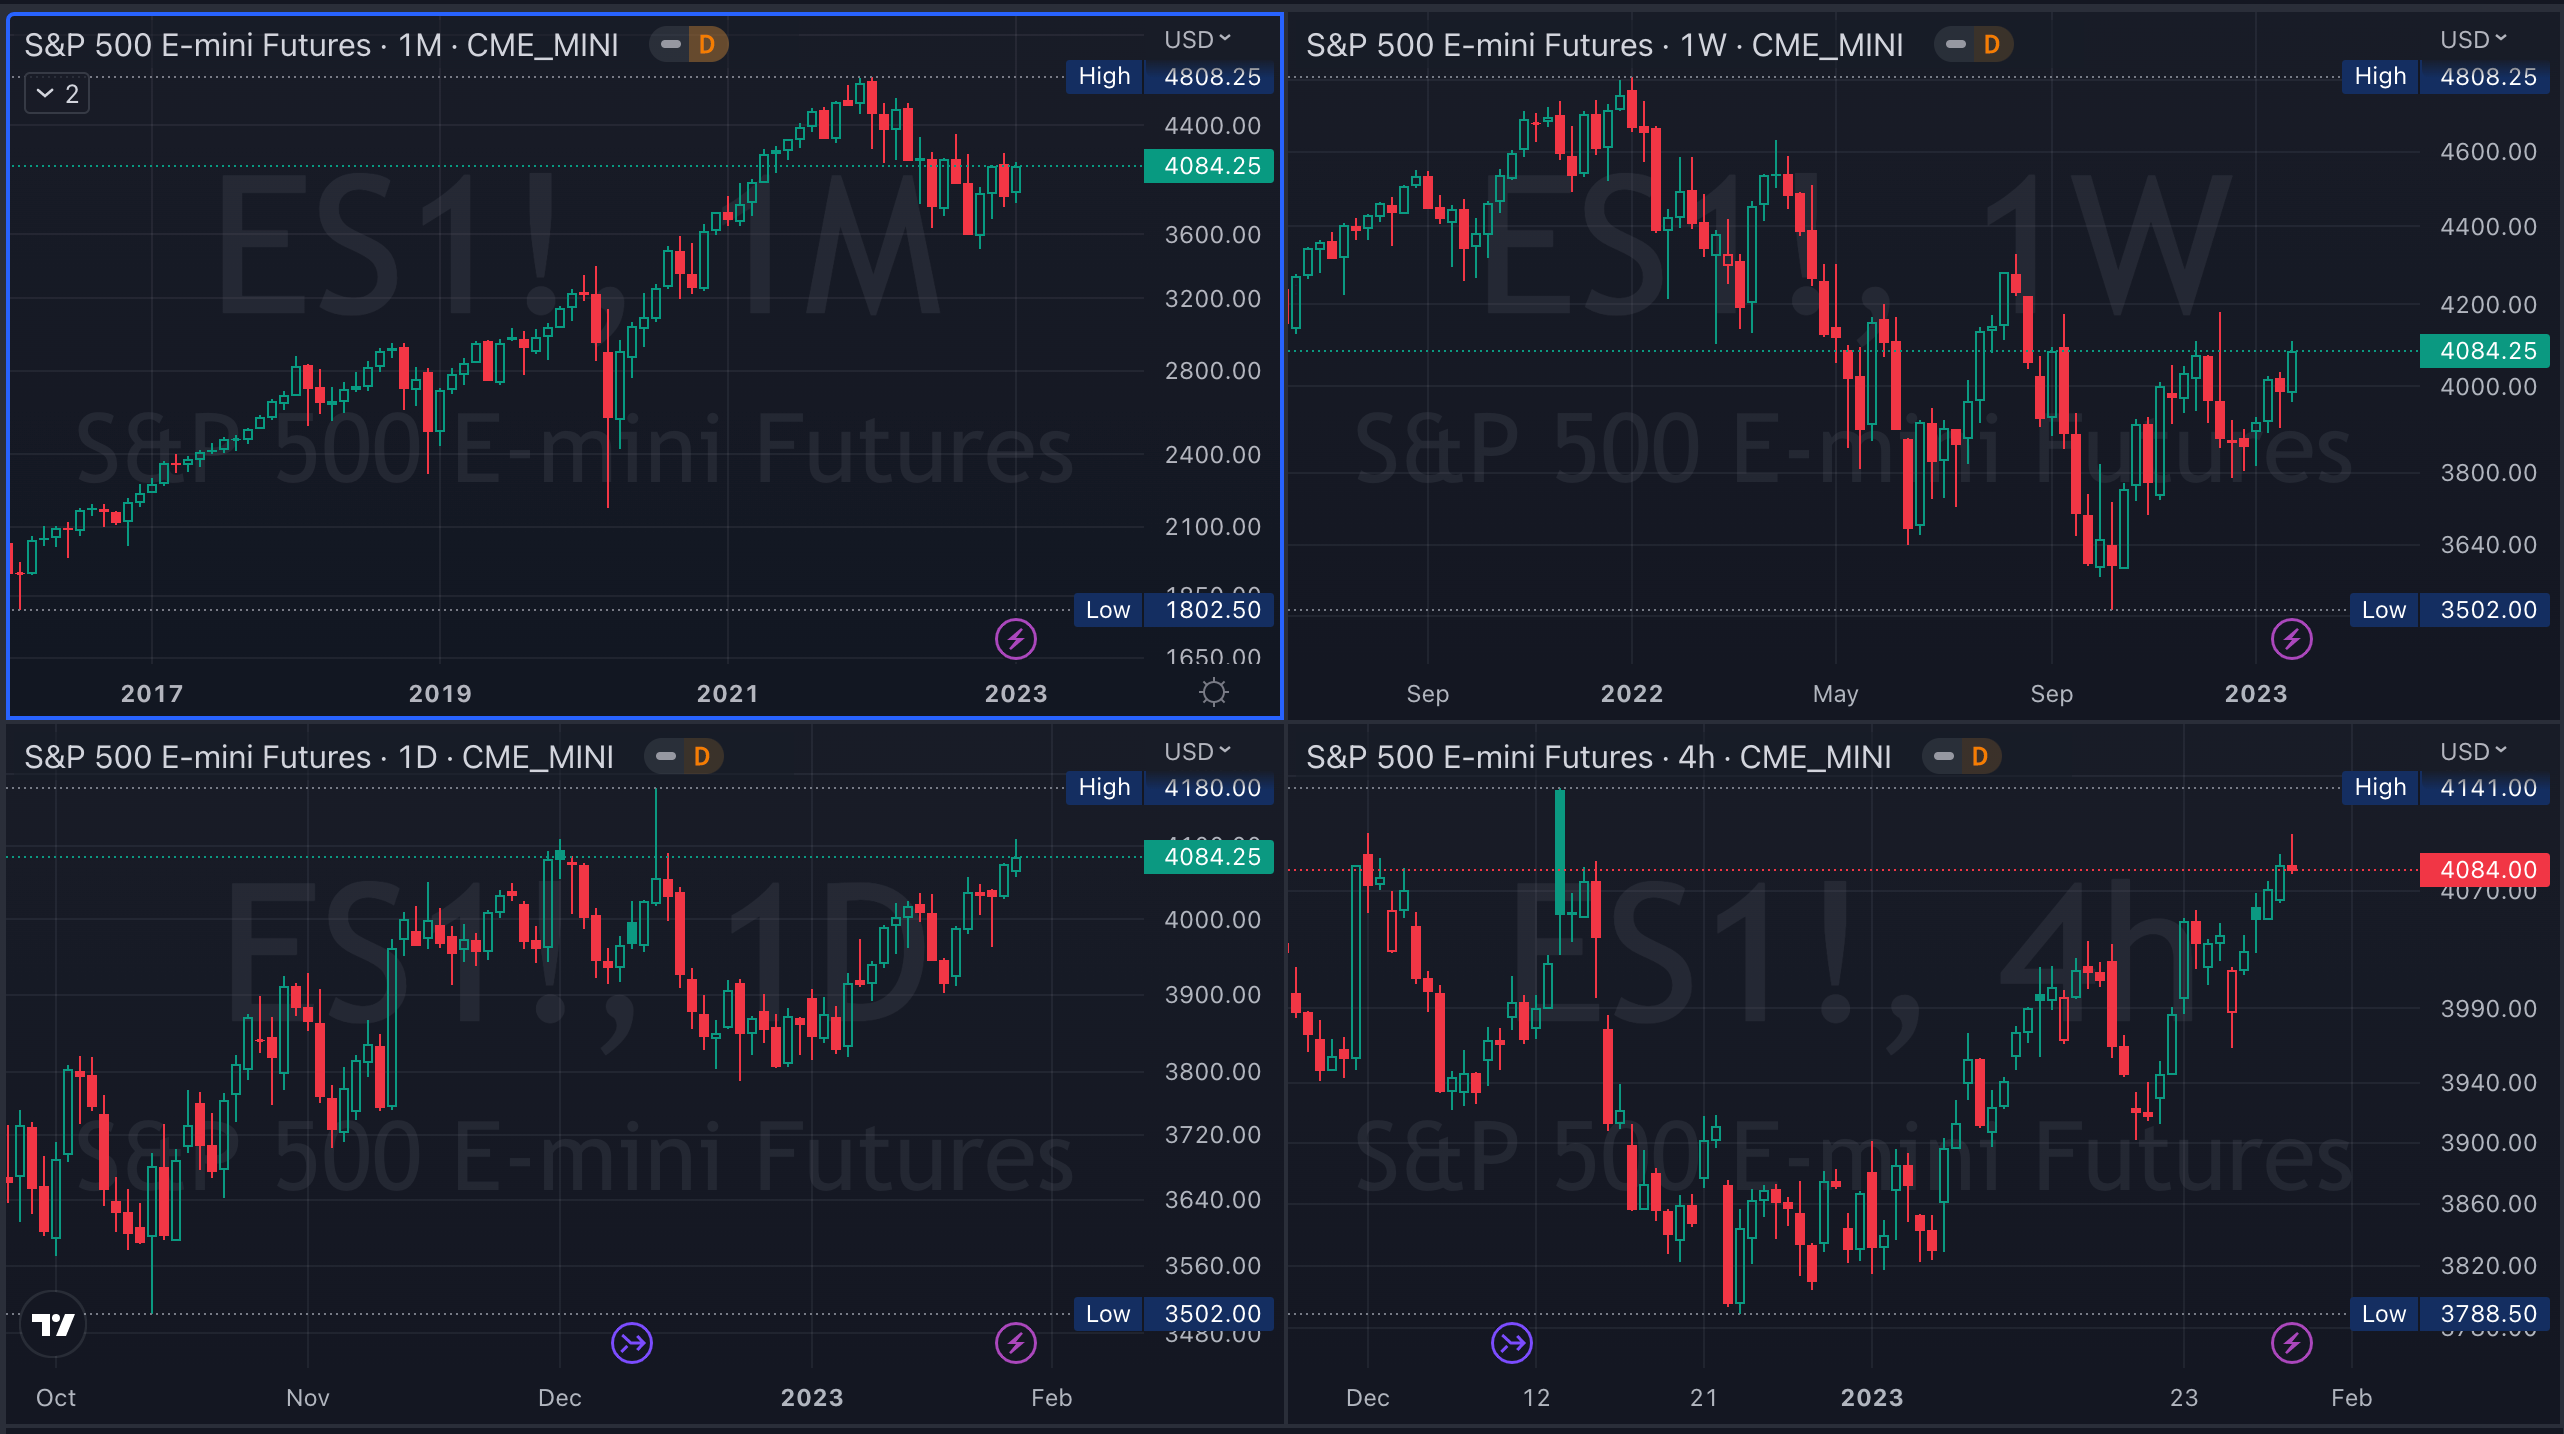
M/M: Despite falling in December, $ES is still OTFU after failing to erase November’s low. $ES failed and close beneath the 10-month MA.
W/W: For the fifth straight week, $ES_F traded above the prior week’s low and is OTFU.
D/D: $ES_F is also OTFU and has traded above the prior day’s low for two straight days. It closed above the 200-day MA for each of the past 6 days.
E-mini S&P 500 Metrics
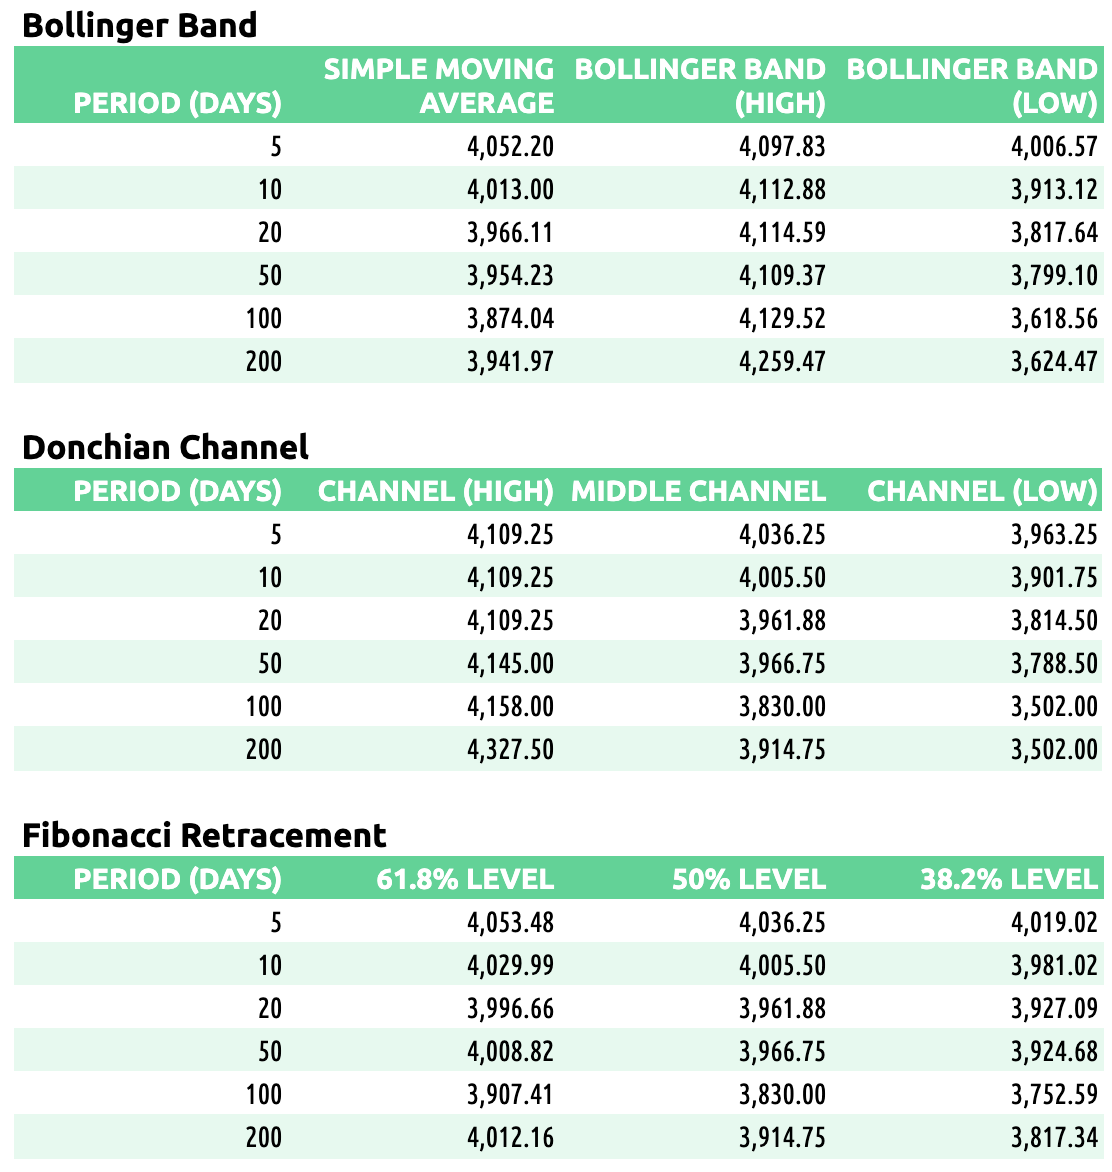
Recent Performance & Technicals

E-mini S&P 500 Volume/Market Profile
ES Composite Volume Profile (5 days)
📈 Here is a chart of the past five sessions with a composite ETH Volume Profile:

ES ETH/RTH Split Volume Profile (5 days)
📈 Here is a chart of the past five sessions with a daily ETH/RTH split Volume Profile:

ES ETH/RTH Split Market/Volume Profile (Friday)
📈 Here’s a TPO chart of Friday’s session with ETH/RTH split Market/Volume Profile:

ES Market/Volume Profile Levels

RTH Weak High/Low: n/a
RTH Single Prints: n/a
RTH Excess: 4061.75 to 4063; 4106.25 to 4109.25
RTH Gap: n/a
Session Recap
Electronic Trading Hours (ETH)
Overnight Session:
Wholesale was long at Thursday’s close. Friday’s overnight open was inside the prior day’s value area. The overnight session lacked any follow through in either direction as all price action was constrained in a 13-point channel that was almost entirely short. Trapped shorts kept the auction from falling beneath 4057.
Range: 13
Regular Trading Hours (RTH)
US Session:
RTH opened inside the previous day’s value area. Supply was a non-factor as buyers absorbed all of it on their way to lift the auction over the overnight high and prior day’s high. The IB period encompassed a 30-point range. At 4093.75, supply was hit and buying diminished. This resulted in a pullback that nearly touched the IB low but the bid held steady at 4063. $ES_F rotated up again and gained 50-points before hitting supply again at 4109.25. A 30-point backfill followed but the auction found a bid near VWAP before closing the session at 4084.
Range: 47.50