
01/18/2023 Synopsis
Equities fell again on earnings reports and economic data. The US federal government hit its debt ceiling which will become a talking point for many in Washington.

Market Overview

Equity indices were knocked down for the 3rd day in a row. The Russell fell the most while the Dow and S&P dropped the least. The S&P 500 closed below its 10-day MA. Three S&P sectors were positive with energy leading the gainers. Industrials were the worst performing sector to the downside. CMA 0.00%↑ was the best performing individual ticker, rising 6.13%. ENPH 0.00%↑ led the losing tickers on the downside, giving up 10.67%.
US Treasury yields all moved higher to erase earlier losses. The yield on the 2-year note gained 4.2 bps to finish at 4.13%. The 10-year rate finished at 3.39% for a gain of 2.1 bps.
The US Dollar index $DXY fell to 102.05, for a loss of 0.35%.
Crude oil added 1.02% to end the session at 80.61.
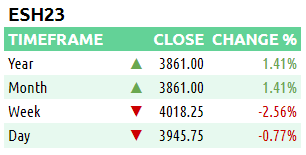
Here are some of today’s closing prices.

E-mini S&P 500 Top-Down Analysis
📈 Below are the monthly (5-years), weekly (2-years) and daily (6-months) charts for ES.
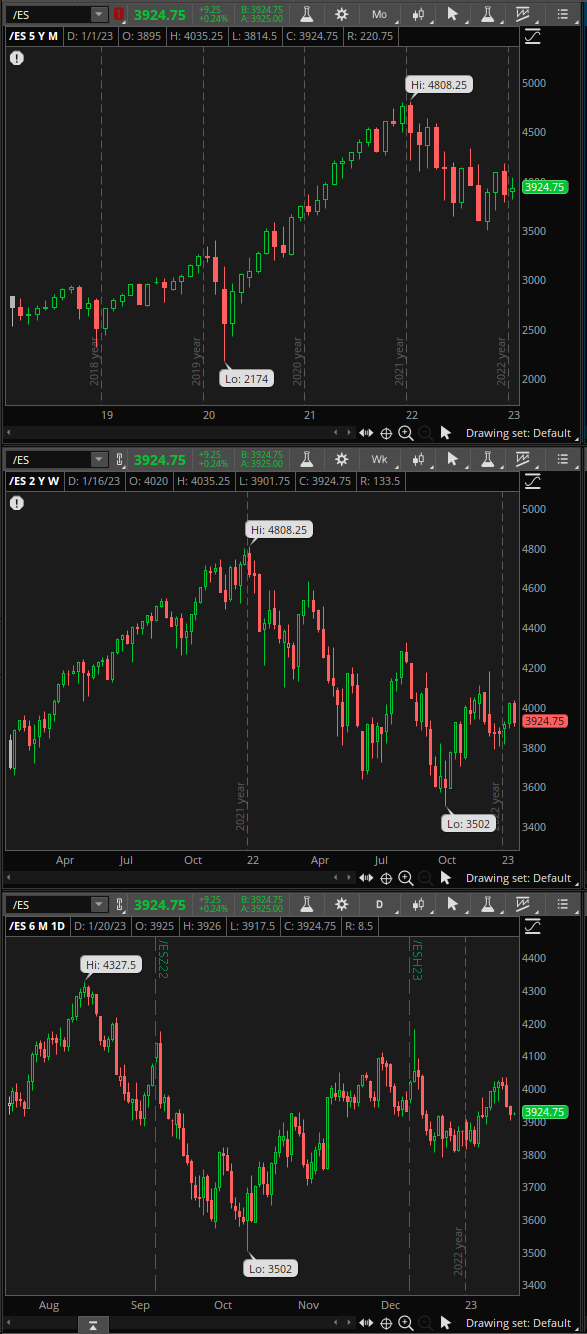
M/M: Despite falling in December, $ES is still OTFU after failing to erase November’s low. $ES failed and close beneath the 10-month MA.
W/W: For the third straight week, $ES_F traded above the prior week’s low. It has also risen and closed above both the 10-week and 40-week MA’s.
D/D: For the second straight day, $ES_F traded below the prior day’s high. It’s OTFU and closed back below the 10-day MA.
E-mini S&P 500 Metrics
Recent Performance & Technicals


E-mini S&P 500 Volume/Market Profile
ES Composite Volume Profile (5 days)
📈 Here is a chart of the past five sessions with a composite ETH Volume Profile:

ES ETH/RTH Split Volume Profile (5 days)
📈 Here is a chart of the past five sessions with a daily ETH/RTH split Volume Profile:

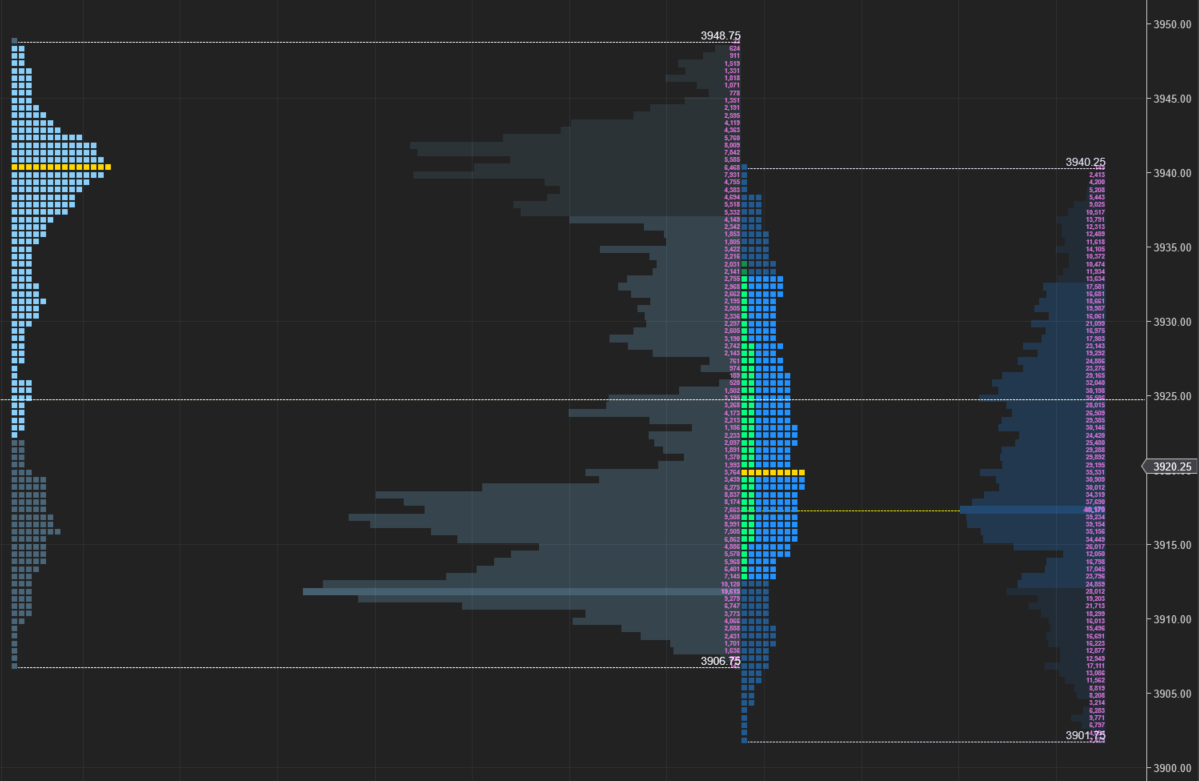
ES ETH/RTH Split Market/Volume Profile (today)
📈 Here’s a TPO chart of today’s session with ETH/RTH split Market/Volume Profile:
ES Market/Volume Profile Levels

RTH Weak High/Low: n/a
RTH Single Prints: n/a
RTH Excess: 3901.75 to 3904.50; 3938.50 to 3940.25
RTH Gap: 3940.25 to 3943.75
Session Recap
Electronic Trading Hours (ETH)
Globex Session:
The overnight open was inside the prior day’s value area. Inventory during the overnight session was mostly short. Early in the session, buyers could not lift the offer beyond 3948.75. $ES_F slid underneath the prior day’s low as supply slowly pushed the auction lower. At 3906.75, supply shut off and short covering resulted in a brief 20-point bounce off the session low. VPOC for the overnight session was 3940.25.
Range: 42
Regular Trading Hours (RTH)
US Session:
The NYSE opened up on a gap down underneath the prior day’s low and T+2 low. The opening hour showed investors were undecided. Price action rotated back and forth in a 20-point range with B-period ending 3-points below where A-period began. After the opening hour, $ES_F continued to sell off with supply moving the auction underneath the opening range. At 3901.75, shorts covered and sellers could no longer take out the bid. $ES_F rallied and got back into and eventually over the opening range by several points. Nearly 40-points later, buyers hit more supply at 3940.25, several points short of the prior day’s low. $ES_F was unable to fill the gap as trapped longs hit the bid and knocked the price down about 25-handles in the final hour of NYSE trading.
Range: 38.50