
01/18/2023 Synopsis
Bonds were up while stocks and rates were down on weak economic data.

Market Overview

The VIX climbed while stock indexes rolled over. The Dow had the steepest decline of 1.81%. The Nasdaq held up the best, losing only 1.24%. The S&P closed underneath its 200-day MA again. Every S&P sector was red. Consumer staples were hit the hardest and communication services fell the least.
US Treasury yields fell as investors put money into bonds. The yield on the 2-year note was knocked down 12.2 bps to 4.09%. The 10-year yield gave up 18.1 bps to fall to 3.37%. The 10-year is down 13.12% YTD.
The US Dollar index $DXY had a small gain of 0.03% to close at 102.41.
Crude oil slipped 0.47% down to 79.80.
Here are some of today’s closing prices.

E-mini S&P 500 Top-Down Analysis

📈 Below are the monthly (5-years), weekly (2-years) and daily (6-months) charts for ES.

M/M: Despite falling in December, $ES is still OTFU after failing to erase November’s low. $ES failed and close beneath the 10-month MA.
W/W: For the third straight week, $ES_F traded above the prior week’s low. It has also risen and closed above both the 10-week and 40-week MA’s.
D/D: $ES_F ended the streak of OTFU. From the highs, it fell nearly 90-points. It closed under the 200-day MA and is in a balance area now.
E-mini S&P 500 Metrics
Recent Performance & Technicals

E-mini S&P 500 Volume/Market Profile
ES Composite Volume Profile (5 days)
📈 Here is a chart of the past five sessions with a composite ETH Volume Profile:

ES ETH/RTH Split Volume Profile (5 days)
📈 Here is a chart of the past five sessions with a daily ETH/RTH split Volume Profile:

ES ETH/RTH Split Market/Volume Profile (today)
📈 Here’s a TPO chart of today’s session with ETH/RTH split Market/Volume Profile:

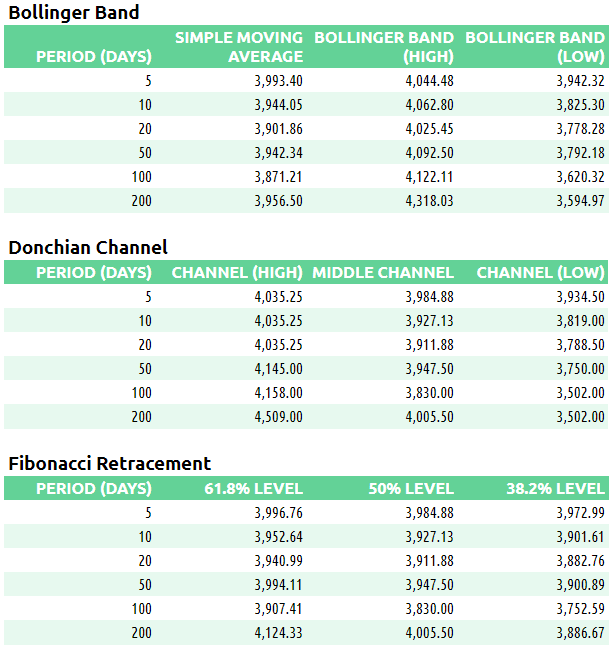
ES Market/Volume Profile Levels

RTH Weak High/Low: n/a
RTH Single Prints: 3947.25 to 3956.50; 3972.50 to 3973.50; 3985.25 to 3996.50; 4006 to 4015.75
RTH Excess: 3943.75 to 3944.75; 4029 to 4033.50
RTH Gap: n/a
Session Recap
Electronic Trading Hours (ETH)
Globex Session:
Wholesale was short at the prior day’s close. The overnight open was right at the prior day’s VAL. Inventory sold off initially during the overnight session, falling below the prior day’s low. At 3996.25, supply shut off and couldn’t hit the bid lower. Inventory reversed to the upside and was long for the remainder of Globex (nearly 12 hours). At 4032.75, buyers could no longer lift the bid with supply present at this level. VPOC in the over night was 4014.25.
Range: 36.50
Regular Trading Hours (RTH)
US Session:
The NY open was above the prior day’s value area but inside it’s trading range. It was also inside the T+2 high. At the open, sellers moved the auction back into the prior day’s value area momentarily. However, the market turned up as buyers lifted the offer and auction back above the prior day’s value area, as well as the overnight high. At 4033.50, the rally lost steam and supply pressured $ES_F. Over the next 7-TPO periods, the bid was nowhere in sight and price dropped 80-points. At 3956.50, short covering stabilized the auction momentarily. In the final hour of the NYSE trading, more selling occurred and $ES_F went down another leg lower. At 3943.75, additional short covering prevented more losses. The RTH session ended at 3945.75
Range: 89.75