
01/17/2023 Synopsis
The tech-heavy Nasdaq led the way while the S&P, Dow and Russell all fell. US Empire State Manufacturing data comes in below expectations.

Market Overview

Equities indices were mixed to begin the short week. Every index was red with the exception of the Nasdaq, up 0.14%. The Dow saw the deepest decline of 1.14%. Five S&P sectors were positive with tech leading the way. Materials was the worst performing sector as it slid 1%.
US Treasury yields were all up along the yield curve. The yield on the 3-month was up 3.6 bps to 4.72%. The 2-year yield climbed 1.5 bps to 4.21%. The yield on the 10-year note gained 2.5 bps to 3.56%.
The US Dollar index $DXY fell 0.17% to 102.38.
Crude continues to rise and has the 2023 intraday high in its sights. It was up 0.4% and finished the day at 80.18.
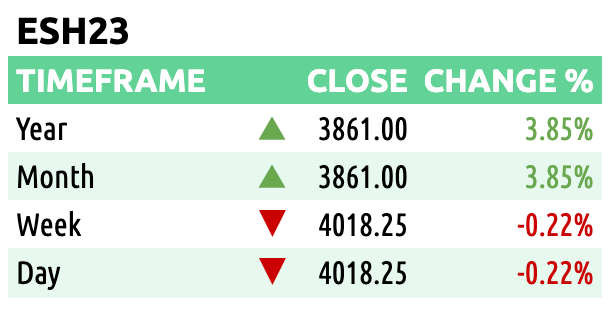
Here are some of today’s closing prices.

E-mini S&P 500 Top-Down Analysis
📈 Below are the monthly (5-years), weekly (2-years) and daily (6-months) charts for ES.
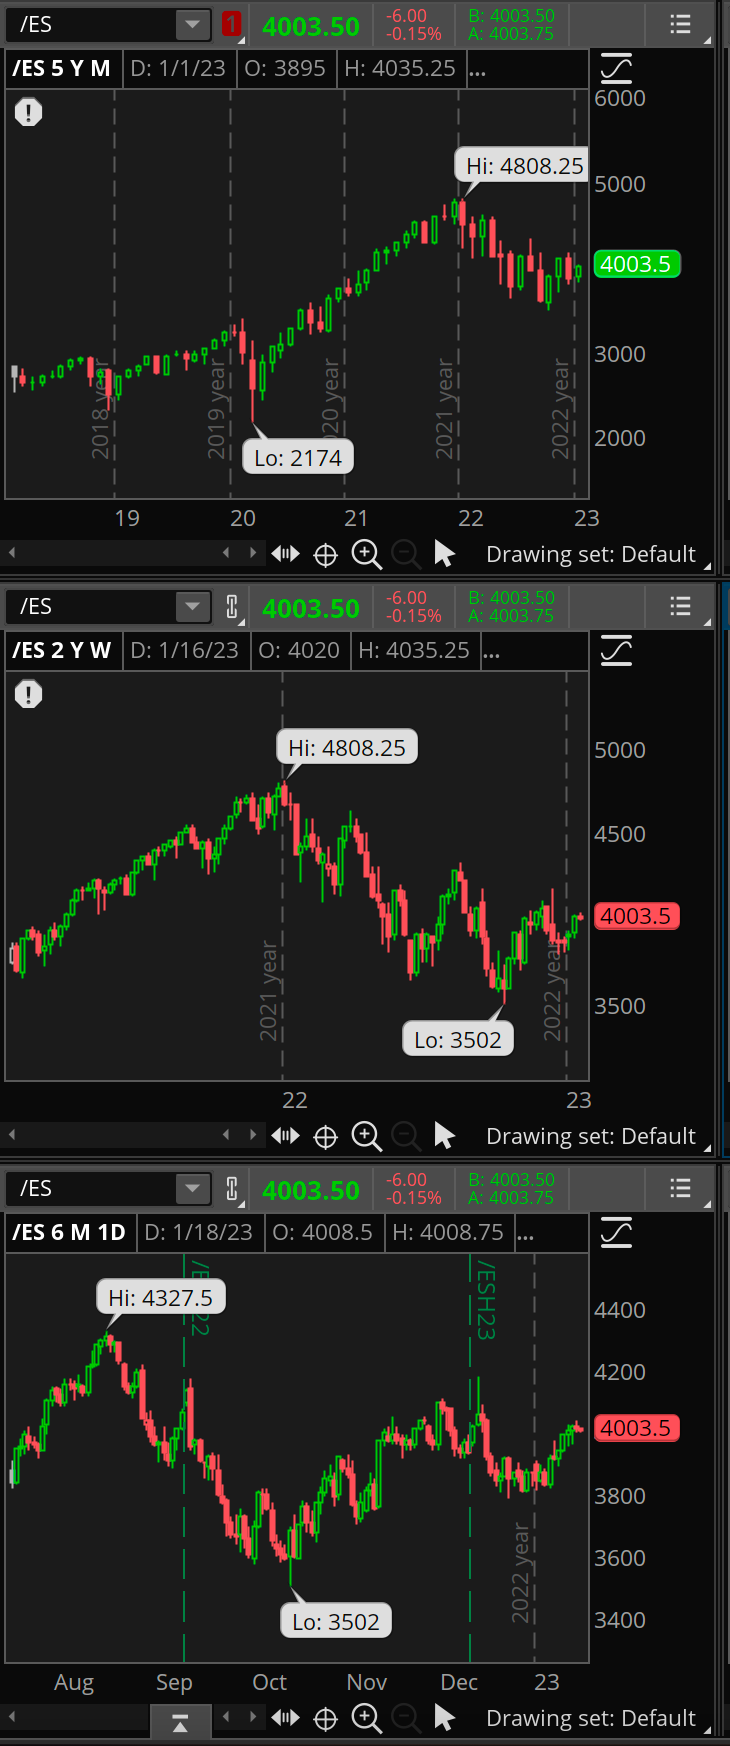
M/M: Despite falling in December, $ES is still OTFU after failing to erase November’s low. $ES failed and close beneath the 10-month MA.
W/W: For the third straight week, $ES_F traded above the prior week’s low. It has also risen and closed above both the 10-week and 40-week MA’s.
D/D: $ES_F broke a string of four green days. It continues to OTFU.
E-mini S&P 500 Metrics
Recent Performance & Technicals


E-mini S&P 500 Volume/Market Profile
ES Composite Volume Profile (5 days)
📈 Here is a chart of the past five sessions with a composite ETH Volume Profile:

ES ETH/RTH Split Volume Profile (5 days)
📈 Here is a chart of the past five sessions with a daily ETH/RTH split Volume Profile:

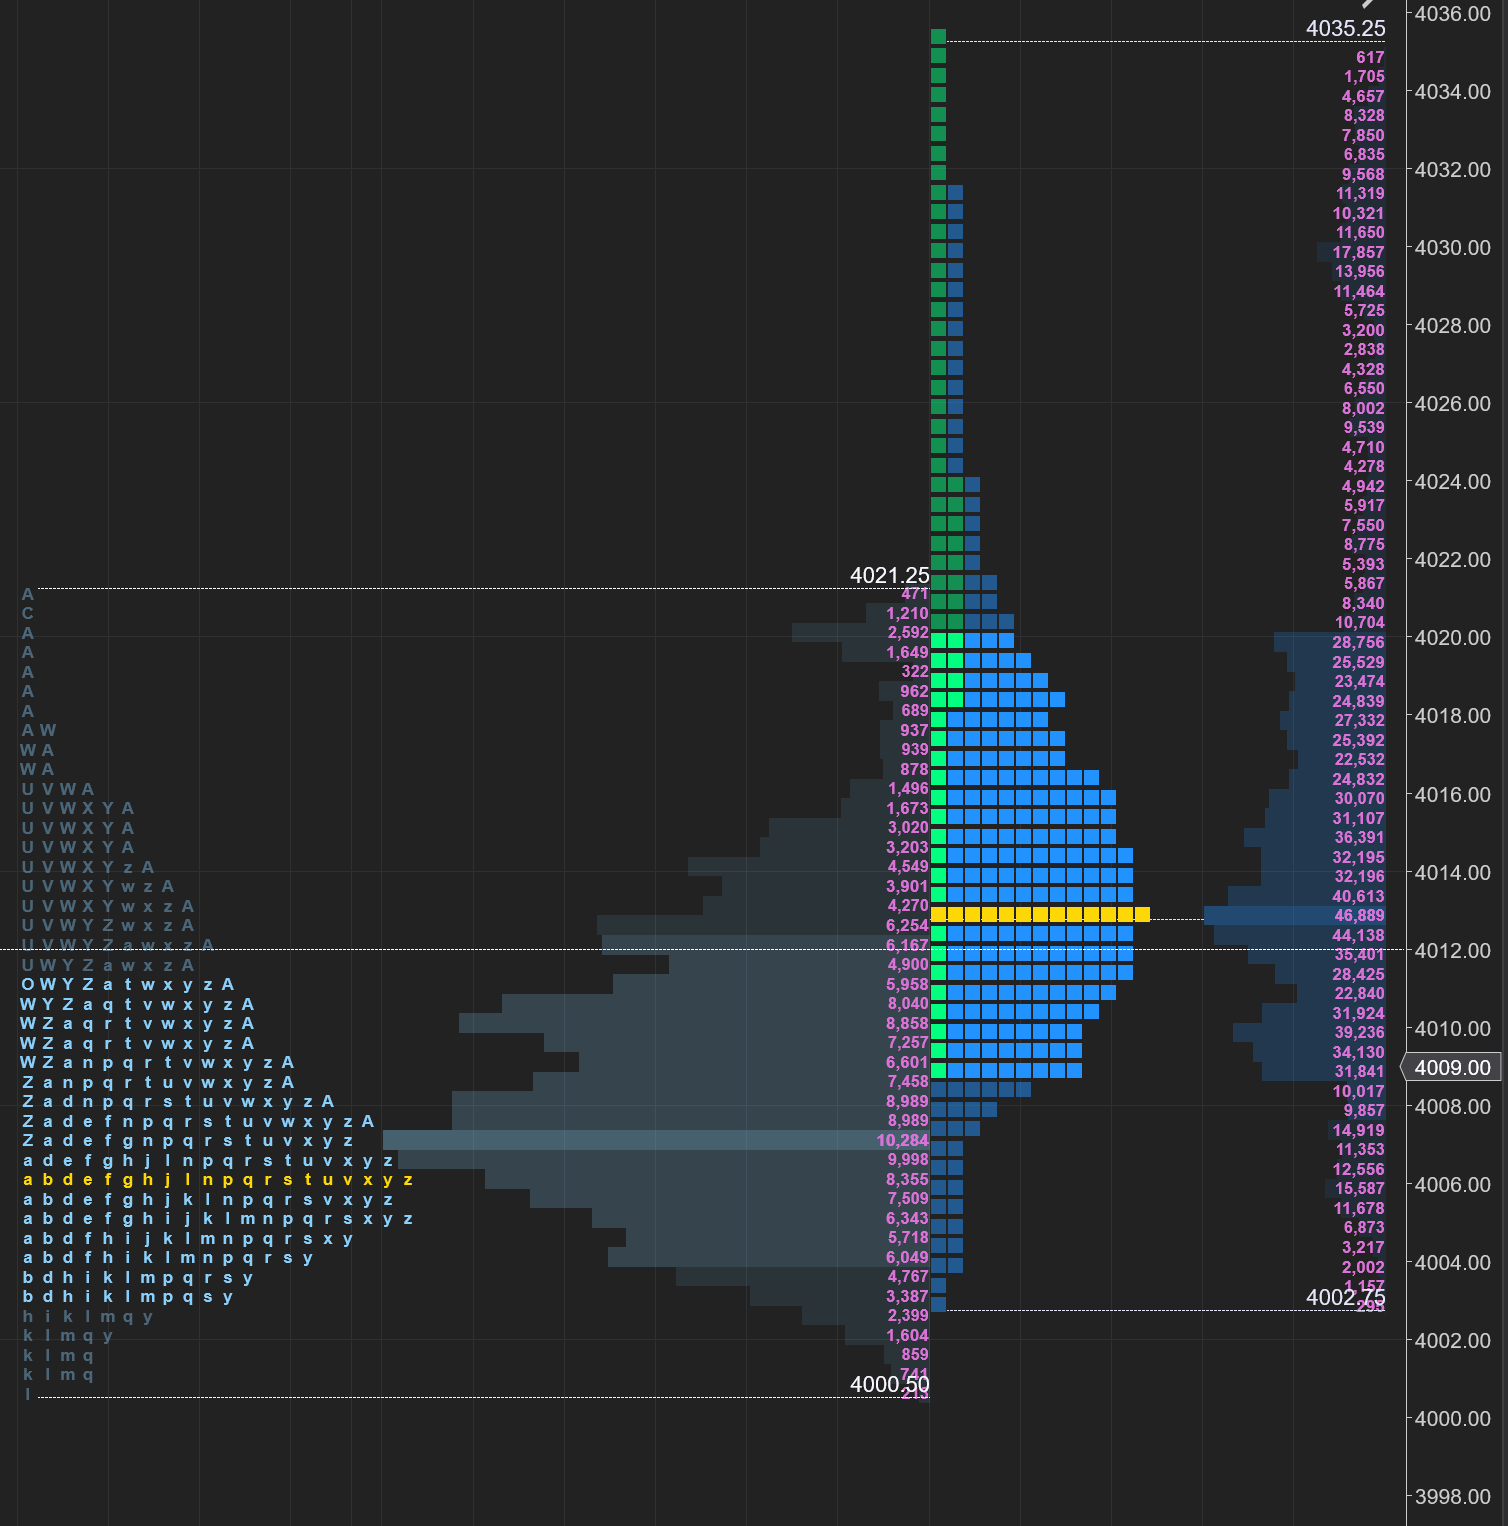
ES ETH/RTH Split Market/Volume Profile (today)
📈 Here’s a TPO chart of today’s session with ETH/RTH split Market/Volume Profile:
ES Market/Volume Profile Levels

RTH Weak High/Low: n/a
RTH Single Prints: n/a
RTH Excess: 4002.75 to 4004; 4031.25 to 4035.25
RTH Gap: n/a
Session Recap
Electronic Trading Hours (ETH)
Globex Session:
Wholesale was long at Friday’s close. The CME and futures market was partially open yesterday. $ES_F was short in a range from 3996.75 and 4028.25. This range aws mostly inside Friday’s value area with the top end of the range exceeding Friday’s high by a couple of points. Today’s overnight open was inside of Friday’s value area. The overnight session was entirely inside of the value area in a 20-point range from 4000.5 to 4021.5. The overnight session was mostly short the entire overnight session but corrected long right before the start of RTH. VPOC was 4007.50.
Range: 21
Regular Trading Hours (RTH)
US Session:
The RTH open was inside of Friday’s value area and also inside the T+2 range. The first half hour of the US open, or A-period, $ES_F was directionless as is moved in a 15-point range. Buyers tried to get above Friday’s high but responsive sellers helped move the auction lower towards Friday’s close. In B-period, supply was not nearly as strong as $ES_F pushed through Friday’s high and rallied nearly 20-points. At 4035.25, buyers could no longer lift the offer and supply came back in to move the market lower. In C-period, supply pushed $ES_F 20-handles lower and towards the bottom of the opening range. $ES_F was caught rangebound for the remainder of the day. Trapped longs above 4021 supplied a wall of offers while trapped shorts underneath 4000 created a wall of bids. $ES_F’s price action couldn’t break in either direction outside of this range. RTH closed at 4009.
Range: 32.50