01/13/2023 Synopsis
Stocks erased early losses to end the week higher. The S&P 500 has had four straight days with gains, the longest streak since September. Stock and bond markets are closed tomorrow for MLK Day.
Market Overview
Equities climbed higher again to close out the week. Every index was positive with the Nasdaq leading. The S&P 500 is up 4.16% to begin 2023. Eight sectors were green as consumer discretionary led. Real estate was the worst performing sector.
US Treasury yields were all positive. The 3-month yield gained 2 bps to 4.51%. The yield on the 2-year note rose 8.1 bps to 4.23%. The yield on the 10-year climbed 5.5 bps to 3.5%.
The US Dollar index $DXY has a small loss of 0.06% and ended the day at 102.19.
Crude oil popped 2% to 79.97. It was the 7th straight positive session for $CL_F.
Events this week:
Here are some of Friday’s closing prices.
E-mini S&P 500 Top-Down Analysis
📈 Below are the monthly (5-years), weekly (2-years) and daily (6-months) charts for ES.
M/M: Despite falling in December, $ES is still OTFU after failing to erase November’s low. $ES failed and close beneath the 10-month MA.
W/W: For the third straight week, $ES_F traded above the prior week’s low. It has also risen and closed above both the 10-week and 40-week MA’s.
D/D: For the third straight day, $ES_F’s price action was entirely above the prior day’s low. It is OTFU and has had four consecutive positive sessions.
E-mini S&P 500 Metrics
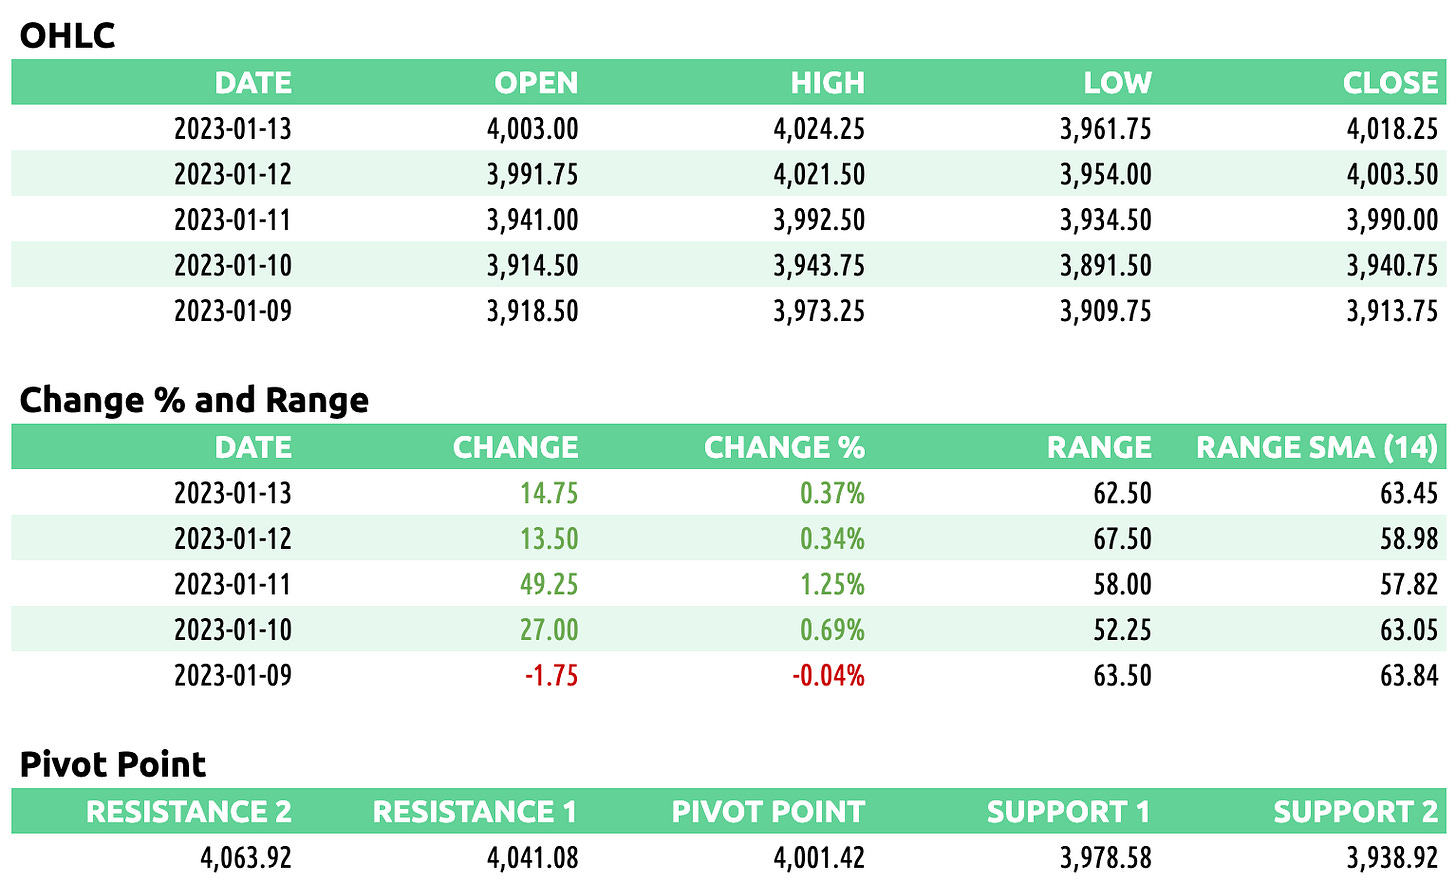
Recent Performance & Technicals
E-mini S&P 500 Volume/Market Profile
ES Composite Volume Profile (5 days)
📈 Here is a chart of the past five sessions with a composite ETH Volume Profile:
ES ETH/RTH Split Volume Profile (5 days)
📈 Here is a chart of the past five sessions with a daily ETH/RTH split Volume Profile:
ES ETH/RTH Split Market/Volume Profile (Friday)
📈 Here’s a TPO chart of Friday’s session with ETH/RTH split Market/Volume Profile:
ES Market/Volume Profile Levels
RTH Weak High/Low: n/a
RTH Single Prints: 4002.25 to 4004.50; 4011.50 to 4014.25
RTH Excess: 3965.75 to 3975.50; 4020 to 4024.25
RTH Gap: n/a
Session Recap
Electronic Trading Hours (ETH)
Globex Session:
Wholesale was long at the prior day’s close. The overnight open was inside of the prior day’s value area. Buyers failed to lift the offer above 4008.25. There was a double top early in the overnight session, an indication of sellers. Inventory corrected short and remained short for much of the overnight. There was another rotation up which failed to test the previous double top. As US banks released their Q4 earnings, the market began to slide. Trapped long supply began selling and there were no buyers. $ES_F slid 45-points in the latter hours of the overnight session. At 3961.75, supply ran out as sellers couldn’t lower the bid. VPOC in the overnight session was 3966.75.
Range: 46.50
Regular Trading Hours (RTH)
US Session:
The NYSE open was inside of the prior day’s price range but below the value area. The open was also inside the T+2 range. There was short covering at the session low towards the end of RTH and any supply was absorbed by those buyers to begin the RTH session. Sellers couldn’t move the bid below 3965.75 and the auction rotated up. Buyers chewed through supply and were able to move $ES_F 33-points in the opening hour. This move took the market back into the prior day’s value area, as well as the upper distribution from the overnight session. At 4000.75, there were responsive sellers and the market sank 15-points. There wasn’t enough supply to bid below 3985 and $ES_F slowly crept higher. In I-period, $ES_F broke out and rose above the overnight high. The auction eclipsed the prior day’s high and topped out at 4024.25 before ending RTH at 4019.
Range: 58.50


