01/12/2023 Synopsis
Stocks were positive again as December CPI readings come in as expected.
Market Overview
Equities were positive once again. Every index gained with the Russell 2000 leading. Eight S&P sectors moved higher with energy leading. Consumer staples fared the worst out of all the losing sectors.
The yields on US Treasuries of all durations slid as bonds rose. The market is pricing in a 25 bps rate hike (96.2% likelihood) at the February FOMC meeting. The Bloomberg Core US Aggregate Bond ETF, AGG 0.00%↑, has now reached its highest price level since September. The 3-month yield slid 6 bps down to 4.5%. The 2-year yield dropped 7.7 bps down to 4.14%. The 10-year yield lost 10 bps and closed at 3.45%.
The US Dollar index $DXY continues to trend downward. It lost nearly 1% to fall to 102.24, its lowest price since June 9th.
Crude oil gained 1.23% to finish at 78.36.
According to CME, the expectation is a 25 bps rate hike at the Fed’s next FOMC meeting in February:
Here are some of today’s closing prices.
E-mini S&P 500 Top-Down Analysis
📈 Below are the monthly (5-years), weekly (2-years) and daily (6-months) charts for ES.
M/M: Despite falling in December, $ES is still OTFU after failing to erase November’s low. $ES failed and close beneath the 10-month MA.
W/W: $ES_F ended 4 consecutive weeks of red. It’s also OTFU as for the second straight week, price has failed to trade below the prior week’s low.
D/D: $ES_F gapped up and for the second day in a row failed to trade below the prior day’s low. It’s OTFU and also closed above the 200-day MA for the first time in a month.
E-mini S&P 500 Metrics
Recent Performance & Technicals
E-mini S&P 500 Volume/Market Profile
ES Composite Volume Profile (5 days)
📈 Here is a chart of the past five sessions with a composite ETH Volume Profile:
ES ETH/RTH Split Volume Profile (5 days)
📈 Here is a chart of the past five sessions with a daily ETH/RTH split Volume Profile:
ES ETH/RTH Split Market/Volume Profile (today)
📈 Here’s a TPO chart of today’s session with ETH/RTH split Market/Volume Profile:
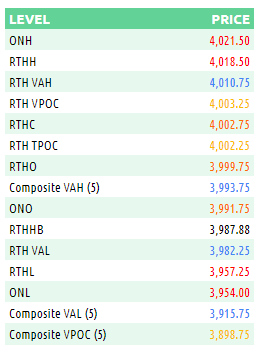
ES Market/Volume Profile Levels
RTH Weak High/Low: n/a
RTH Single Prints: n/a
RTH Excess: 3957.25 to 3969.50; 4018 to 4018.50
RTH Gap: n/a
Session Recap
Electronic Trading Hours (ETH)
Globex Session:
Wholesale was long at the prior day’s close. The overnight open was a tick above the prior day’s value area and inside the prior day’s high. Inventory in the overnight session was mostly short by a few handles. Price traded in a tight 10-point range above and below the prior day’s high. Leading up to the CPI print, $ES_F just hit new highs for the past two weeks but began to correct inventory down as nobody else was buying at those prices. As the CPI print came in, volatility picked up with $ES_F whipsawing back and forth covering a 60-point range. After failing to bid beneath 3954, $ES_F crept up with the offer getting lifted on limited supply. At 4021.50, the auction made another new high and corrected back down 35-points. VPOC for the overnight session was 3988.
Range: 67.50
Regular Trading Hours (RTH)
US Session:
The NY open gapped up and was above the prior day’s high and T+2 high. The auction got sold off early in RTH as buyers near the highs of the overnight session got trapped. $ES_F slid nearly 50-points and closed the overnight gap but supply ran out way short of the T+2 high. The overnight low also held up as $ES_F couldn’t bid below 3957.25 before shorts covered and stabilized the market. In B-period, $ES_F recovered most of the losses from A-period before inventory corrected again after touching 4002.50. The opening range covered 45.75 points from 3957.25 to 4003. $ES_F continued to rise and make higher lows throughout the day, absorbing any and all periods or responsive selling to get above the opening range. The overnight high remained in tact as buyers failed to push the offer over 4018.50 before correcting down 25-points. RTH closed at 4002.75.
Range: 61.25


