
01/11/2023 Synopsis
Stocks tick higher as investors await tomorrow's CPI print. The median forecast is 6.5% CPI Y/Y and 5.7% Core CPI Y/Y.

Market Overview
Every stock index was positive again today with the Nasdaq leading the way. Two sentence summary. The S&P 500 is closing in on its 200-day MA. Every S&P sector was up with real estate having the largest gain at 3.63%. Consumer staples lagged having gained only 0.05%.
The yields on Treasury notes and bonds all fell. The 2-year yield dropped 3.1 bps to 4.22%. The 10-year yield lost 7.8 bps to end up at 3.55%.
The US Dollar index $DXY had a small loss of 0.02% to finish at 103.26.
Crude oil has had 5 straight positive days. This time it accelerated 3.05% to 77.41.
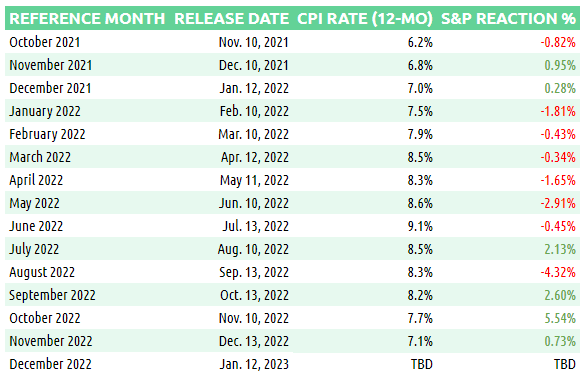
Below are the Y/Y inflation prints since October 2021 when it first spiked above 6%, along with the market’s reaction.
Here are some of today’s closing prices.

E-mini S&P 500 Top-Down Analysis

📈 Below are the monthly (5-years), weekly (2-years) and daily (6-months) charts for ES.

M/M: Despite falling in December, $ES is still OTFU after failing to erase November’s low. $ES failed and close beneath the 10-month MA.
W/W: $ES_F ended 4 consecutive weeks of red. It’s also OTFU as for the second straight week, price has failed to trade below the prior week’s low.
D/D: $ES_F continued to climb. It traded above the prior day’s low and reached the highest price since mid-December. It is right at the 200-day MA.
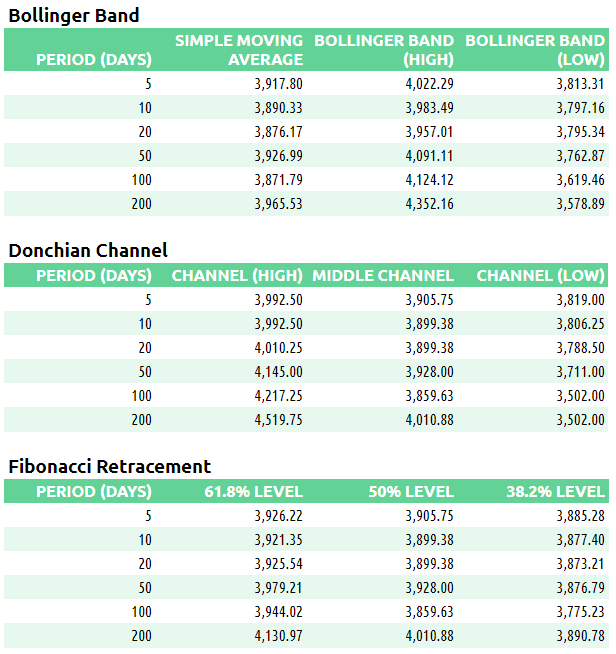
E-mini S&P 500 Metrics
Recent Performance & Technicals

E-mini S&P 500 Volume/Market Profile
ES Composite Volume Profile (5 days)
📈 Here is a chart of the past five sessions with a composite ETH Volume Profile:

ES ETH/RTH Split Volume Profile (5 days)
📈 Here is a chart of the past five sessions with a daily ETH/RTH split Volume Profile:
ES ETH/RTH Split Market/Volume Profile (today)
📈 Here’s a TPO chart of today’s session with ETH/RTH split Market/Volume Profile:

ES Market/Volume Profile Levels

RTH Weak High/Low: n/a
RTH Single Prints: 3984.50 to 3988.50
RTH Excess: 3948.75 to 3949.75; 3990.50 to 3992.50
RTH Gap: 3943.75 to 3948.75
Session Recap
Electronic Trading Hours (ETH)
Globex Session:
Wholesale was long at the prior day’s close. The overnight open was above the prior day’s value area but inside the high of the day. Overnight inventory was mostly long. After trading in a tight, 8-point range, $ES_F began to sell but lack of supply couldn’t push it into the prior day’s value area. Unable to bid below 3934.50, $ES_F corrected upwards as it broke out of the prior day’s range to make new overnight highs. VPOC was 3949.
Range: 25.75
Regular Trading Hours (RTH)
US Session:
The NY open gapped up and was above the prior day’s high and T+2 high. In the opening hour, $ES_F corrected several ticks before climbing nearly 14-points. The auction got above the overnight high but buyers couldn’t lift the offer past 3966.75. Inventory corrected down about 10-points and got long again but failed to offer above 3965.75. In C-period, $ES_F dropped around 17-handles and fell below the opening range but there wasn’t enough supply to fill the overnight gap. After failing to bid below 3948.75, $ES_F rotated up and never looked back. For the remainder of the day, it slowly ascended 50-points on its way to new session highs. $ES_F ended the session at 3992.25, one-tick from its high.
Range: 43.75