01/09/2023 Synopsis
Equities gave up most of their morning gains in an afternoon selloff.
Market Overview
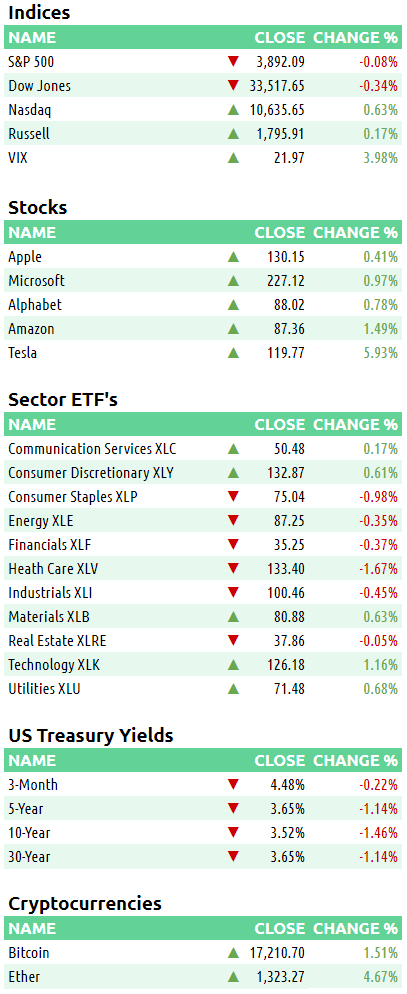
The S&P was up about 1.4% early in the day but gave up most of those gain sin the afternoon to close down 0.08%. All the other major equity indices behaved similarly but the Nasdaq and Russell 2000 managed to close green. Five S&P sectors were up on the day with Tech leading the way. Health care was the worst performer of all sectors, slipping 0.98%.
US Treasury yields were mixed. The 3-month yield was flat. The 2-year yield slid 4 bps to 4.21%. The 10-year yield was down 2.2 bps at 3.54%.
The US Dollar index $DXY fell below its recent trading range and closed at 103.18. The 0.71% fall put $DXY at its lowest price since the first half of June.
Crude oil rose 1.17% to 74.63.
Here are some of today’s closing prices.
E-mini S&P 500 Top-Down Analysis
📈 Below are the monthly (5-years), weekly (2-years) and daily (6-months) charts for ES.
M/M: Despite falling in December, $ES is still OTFU after failing to erase November’s low. $ES failed and close beneath the 10-month MA.
W/W: $ES_F ended 4 consecutive weeks of red. It’s also OTFU as for the second straight week, price has failed to trade below the prior week’s low.
D/D: $ES_F broke out above 3934.50 but lost most of those gains in the afternoon to close back below it and the prior day’s settlement. At the close, $ES_F is still inside the larger balance zone.
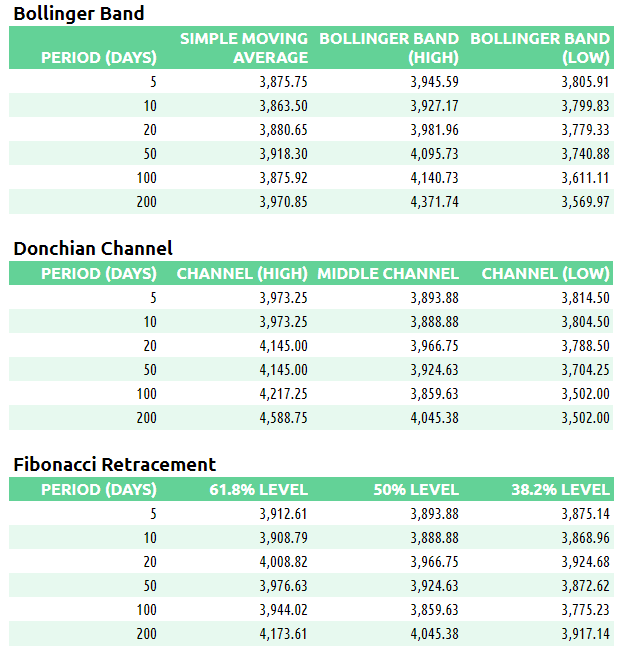
E-mini S&P 500 Metrics
Recent Performance & Technicals
E-mini S&P 500 Volume/Market Profile
ES Composite Volume Profile (5 days)
📈 Here is a chart of the past five sessions with a composite ETH Volume Profile:
ES ETH/RTH Split Volume Profile (5 days)
📈 Here is a chart of the past five sessions with a daily ETH/RTH split Volume Profile:
ES ETH/RTH Split Market/Volume Profile (today)
📈 Here’s a TPO chart of today’s session with ETH/RTH split Market/Volume Profile:
ES Market/Volume Profile Levels
RTH Weak High/Low: n/a
RTH Single Prints: 3914.75 to 3917.25; 3920.75 to 3923; 3927.75 to 3928.50
RTH Excess: 3909.75 to 3910.75; 3972.75 to 3973.25
RTH Gap: n/a
Session Recap
Electronic Trading Hours (ETH)
Globex Session:
Wholesale was long at the prior day’s close. The overnight open was inside the previous day’s value area. Overnight inventory was 100% long. $ES_F failed to bid below 3916.50. $ES_F was hitting new session highs heading into the NY session. There were two sets of single prints on the way up on Friday and those trapped shorts are support. VPOC overnight was 3933.75.
Range: 24.75
Regular Trading Hours (RTH)
US Session:
The NY open gapped up and above the prior day’s high and T+2 high. The US open was volatile once again. There was a market correction at the open and after failing to bid below 3928.50, $ES_F rotated up. The auction rose above the overnight high and was OTFU for the first 5-TPO periods. At 3973.25, $ES_F failed to offer higher as buyers could no longer take out supply. As a result, supply pushed the market lower for the remainder of RTH. $ES_F fell back in and beneath the overnight range as it descended 60-points over 4-hours. $ES_F got into the upper set of single prints from the previous day but sellers couldn’t push lower. At 3909.75, shorts covered to stabilize $ES_F before it ended the day at 3913.50.
Range: 63.50


